Today’s Solana price analysis reveals the cryptocurrency price is moving in a bullish manner as an upward trend has been following, and the price has undergone a notable improvement in the last 24 hours. The bullish upswing has resulted in an impressive enhancement in the price as its value has upgraded to $44.1, as the price has been following a bullish trend since 27 July 2022. Although the price experienced bearish toppling at certain points, now the price might move on to even higher levels in the approaching hours as well.
SOL/USD 1-day price chart: SOL gains 4.90 percent
The 1-day price chart for Solana price analysis shows the coin price has increased significantly today as it is trading at $44.1 at the time of writing. The overall trend line has been upwards with consistent bullish efforts, as SOL reports an increase in price value by 4.90 percent for the last 24 hours and shows a much better 8.19 percent increase in value over the course of the past seven days. The trading volume is a little low as it decreased by 2.45 percent today, and the market cap has increased by 4.94 percent during the last 24 hours resulting in the market dominance of 1.39 percent for Solana.
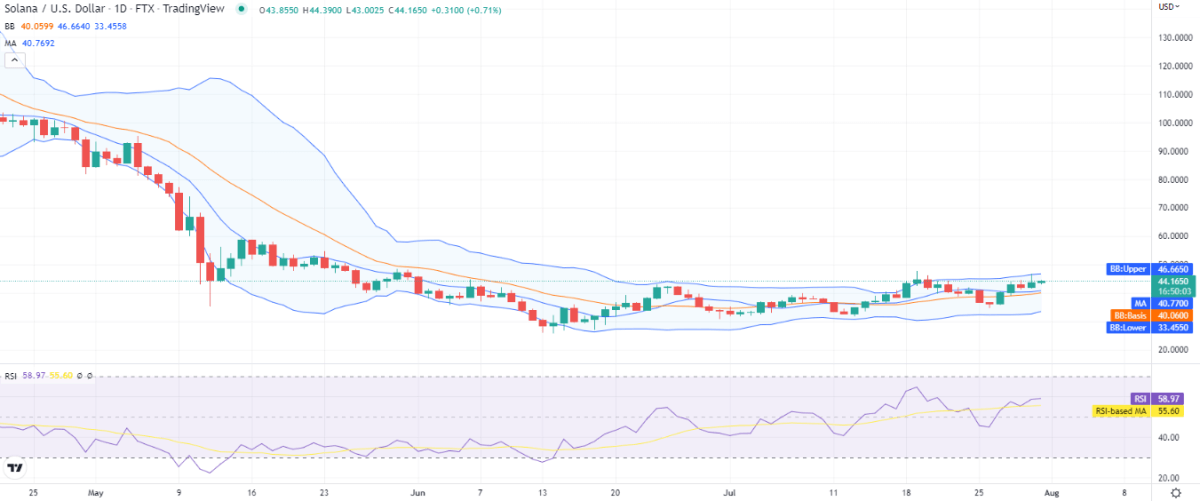 SOL/USD 1-day price chart. Source: TradingView
The volatility is mild as the Bollinger bands continue to follow the same movement, and the price seems to be not breaking out of the range it has been following for the past month. The upper limit of the Bollinger bands is present at the $46.6 mark representing the resistance, and the lower band at the $33.4 mark represents the support; the average of the Bollinger bands is present at the $40 level. The relative strength index (RSI) is trading at index 58 in the upper half of the neutral range on an upwards slope indicating the buying activity in the market.
Solana price analysis: Recent developments and further technical indications
The 4-hour price chart for Solana price analysis shows the price breakout was downwards at the start of today’s trading session, as the coin was in correction for 12 hours, and there on, bulls took the lead back and enhanced the price to $44.1 as they started the upwards march again. Bulls have recovered the price to a level that the bullish trend has been reinstated.
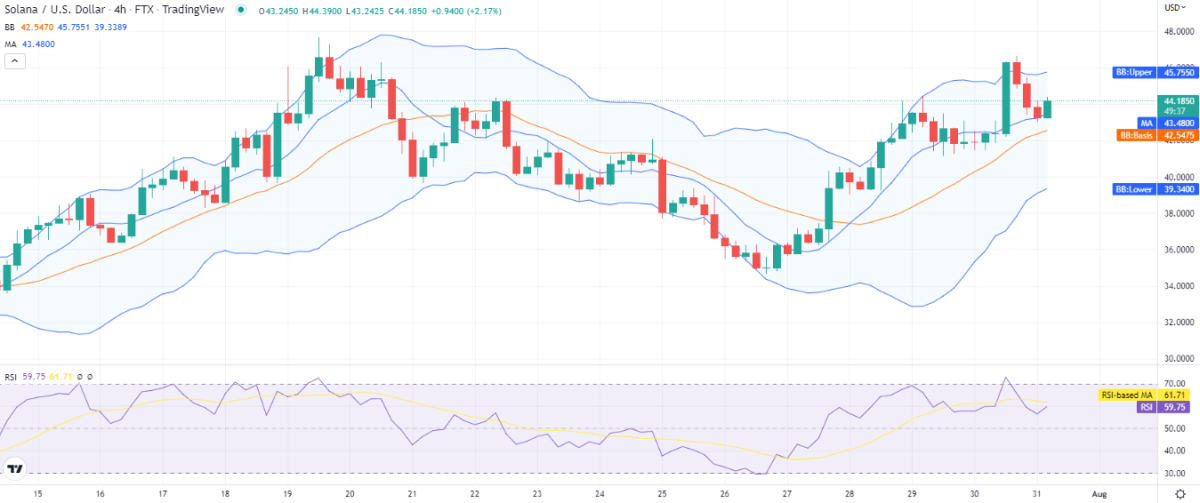 SOL/USD 4-hours price chart. Source: TradingView
The bullish return is also obvious from the RSI curve as well, as it has turned upwards at index 59. Previously the RSI was on the decline for the past few hours after it entered the overbought region yesterday. However, the bulls are also fighting back and may take the price higher in the coming hours. The moving average is also trading far below the price level at the $43.3 mark, and the volatility seems high on the 4-hour chart as well, with the upper band at $45.7 and the lower band at $39.3.
Solana price analysis conclusion
The Solana price analysis shows the bulls have been maintaining their lead successfully. The coin is recovering well, but the price shows range-bound movement, and the overall downtrend has been reversed by the bullish momentum as the price might move to a higher position from that of 19 July 2022, when it last peaked at $44.4. In this case, the coin will make another peak high; we expect SOL to continue upside for today.
Disclaimer. The information provided is not trading advice. Cryptopolitan.com holds no liability for any investments made based on the information provided on this page. We strongly recommend independent research and/or consultation with a qualified professional before making any investment decisions.