The BTG price has experienced a phenomenal bullish drive of a 75% jump in the last four days resulting in the $30 breakout.
Key Technical Points:
- The BTG prices jumped by 29% in the last 24 hours.
- The bullish reversal breaks above the 200-day SMA and teases a bullish crossover of the 50 and 100-day SMA.
- The 24-hour trading volume of Bitcoin Gold is $311 million, indicating a hike of 80%.
Past Performance of BTG
As teased in our previous article, the BTG prices reversed from the $20 mark to jump 75% in the last four days. As a result, the bull run exceeds the $30 mark and approaches the next resistance level at $38. Additionally, the price action displays a rounding bottom breakout with a neckline of $26.5 and exceeds the 200-day SMA. However, the daily candle shows a long-wick formation from the $38 mark, reflecting a slight increase in selling pressure. 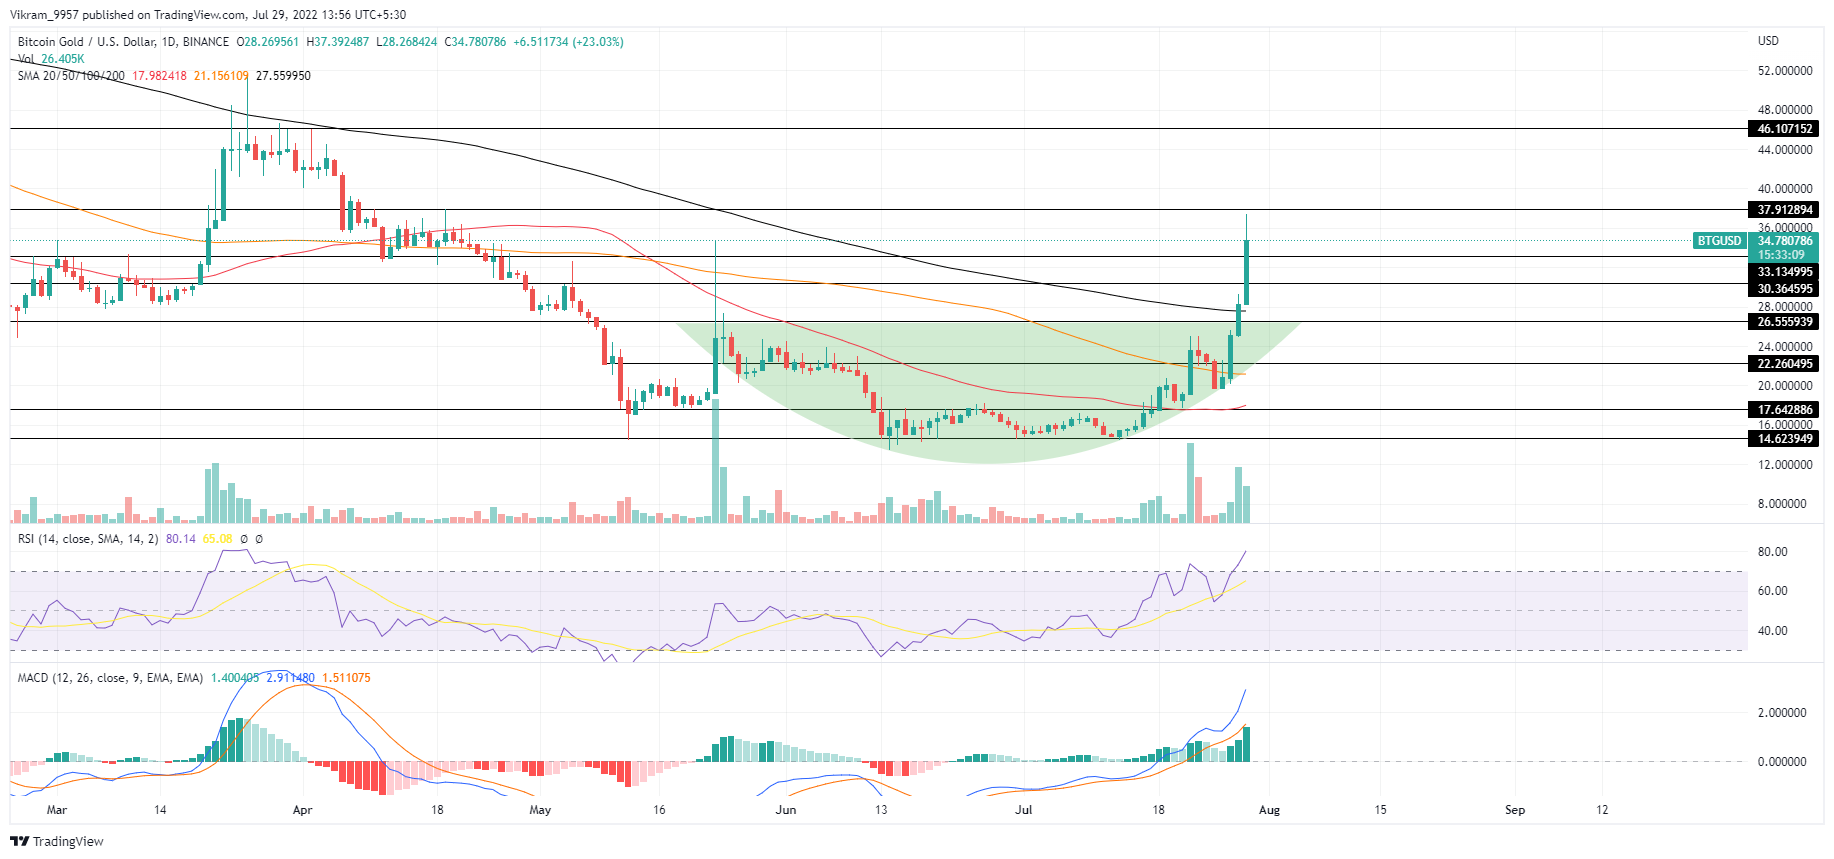 Source - Tradingview
BTG Technical Analysis
The BTG price chart shows the volume indicator depicting a spike in the intraday trading volume, reflecting an increase in buying pressure. However, the buying pressure may shortly sabotage the sellers' uprising to exceed the $38 mark. With the market value exceeding the 200 days average line, the bullish influence on the 50 and 100 days SMA increases. This increases the likelihood of a bullish crossover shortly, improving the market sentiment. The phenomenal increase in market value reflects an increased underlying bullishness as the daily RSI slope reverses sharply from the 14-day SMA to breach into the overbought zone. Furthermore, as the bullish histograms resurface, the MACD indicator displays an increase in the bullish spread between the fast and slow lines. Hence the technical indicator reflects an increase in buying pressure adding points to the uptrend continuation thesis. In a nutshell, the BTG Technical Analysis suggests a bullish trend continuation as the market conditions improve, increasing by buying pressure.
Upcoming Trend
If the BTG prices sustain above the $30 mark, an uptrend continuation will likely exceed the $38 resistance level. Furthermore, traders can expect the bullish trend continuation to hit the psychological mark of $50 if the buying pressures sustain throughout the week. Conversely, a candle closing below the $33 mark will endanger the buyers at the $30 support level. Resistance Levels: $38 and $ Support Levels: $33 and $30