The AXS price action shows a bull run exceeding the $18 horizontal level to reach the opposing 100-day SMA at the psychological mark of $20.
Key Technical Points:
- The AXS prices jumped by 13.61% in the last 24 hours.
- The bullish reversal from the 50-day SMA prepares to overtake the 100-day SMA.
- The 24-hour trading volume of Axie Infinity is $459 million, indicating a hike of 135%.
Past Performance of AXS
As teased in our previous article, the AXS prices continue the uptrend in hopes of reaching the $20 mark. After the supply dump near the $18 mark, the price took support at the 50-day SMA twice before the improved market conditions propelled it higher. The bull run from the $12 support level accounts for a price jump of 50% in the last month. 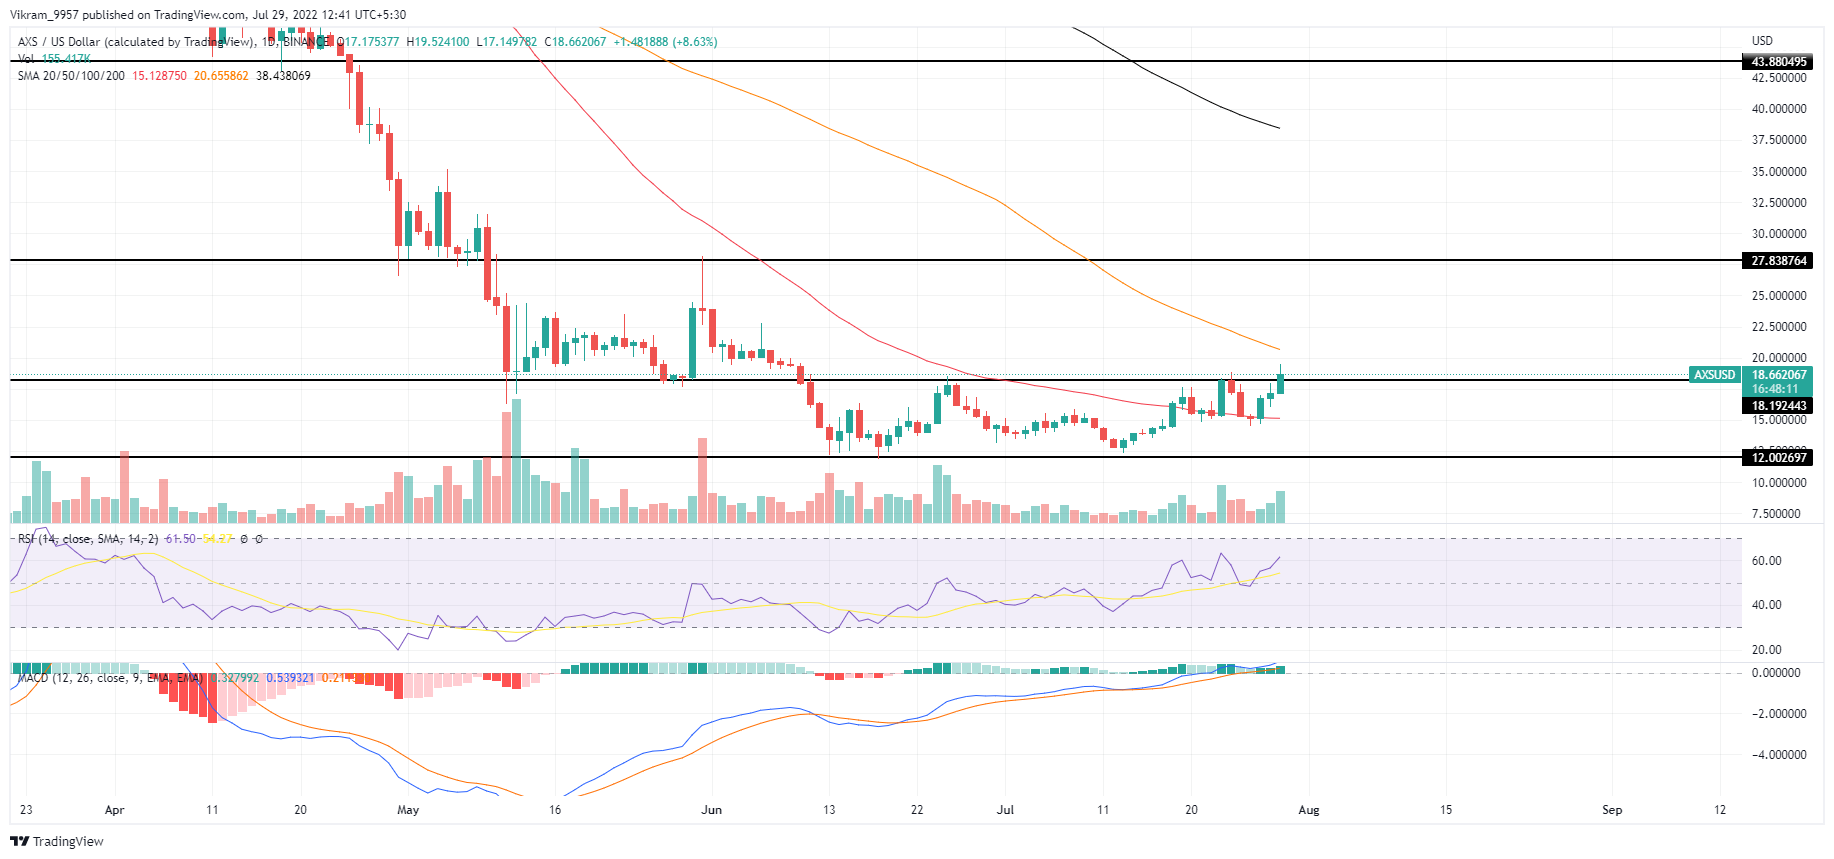 Source - Tradingview
AXS Technical Analysis
The AXS price chart displays an increase in buying pressure supporting the bull run, as evident by the spike in the intraday trading volume. If the prices sustain above $18, the uptrend will have a higher chance of exceeding the psychological mark of $20. After taking multiple support at the 50-day SMA, the price approaches the opposing 100-day SMA in hopes of a bullish breakout. The remarkable increase of 25% in the last three days displays an increase in underlying bullishness evident by the reversal in the RSI slope from the halfway line. The MACD indicator displays an uptrend sustaining in the fast and slow lines above the zero line. In a nutshell, the AXS technical analysis displays an increase in underlying bullishness. It increases the likelihood of a price jump above the psychological mark of $20.
Upcoming Trend
If the AXS prices exceed the $20 mark, a potential bull run to the next resistance level at $27 is possible. This could account for a price jump of 35%. Conversely, if the daily candle fails to close above the $18 mark, the prices may soon retest the 50-day SMA close to the $15 mark. Resistance Levels: $20 and $25 Support Levels: $18 and $15