Polkadot price analysis today shows that the DOT/USD pair continues to rise higher after yesterday’s bullish breakout. The pair has reached a new all-time high of $6.86 and is currently trading at the $6.83 mark. Polkadot price analysis also shows that the bulls have been in control since the beginning of today as they push prices higher. The Resistance for the DOT/USD pair is present at $6.86 and if the bulls can break above this level, we can expect prices to continue rising towards the $7 mark.
Polkadot price analysis also shows that there is a minor support level present at $6.55, which is likely to provide some support for prices if they pull back from current levels. The DOT/USD pair has increased by over 3.33 percent in the past 24 hours and is currently one of the best-performing cryptocurrencies. The 24-hour trading volume for the DOT/USD pair has decreased significantly and is currently at $374,406,259 while the market cap for the DOT/USD pair has increased to $6,743,840,775.
DOT/USD 1-day price analysis: Bulls remain in control
The 1-day Polkadot price analysis reveals that the market has formed a strong bullish trend in the past few days as prices have surged higher. The bulls have been in control of the market as it forms higher highs and higher lows. Prices have surged by over 6 percent in the past 5 days as buyers push prices higher.
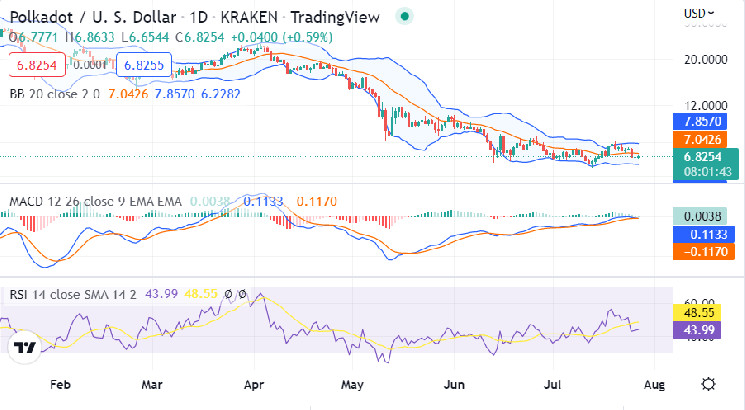 DOT/USD 1-day price chart, source: TradingView
The MACD indicator shows that the market is currently in a strong bullish trend as the MACD line has crossed above the signal line. The RSI indicator for the DOT/USD pair is currently at 63.36, which indicates that the market is currently in the bullish zone. The market volatility is on the rise as the Bollinger bands for the DOT/USD pair have started to expand.
DOT/USD 4-hour price analysis: Recent developments
The 4-hour Polkadot price analysis shows that the price started trading at $6.55 and reached a high of $6.86 after a few hours of trading as the bulls took control of the market. The price has been trading along an ascending support line since the beginning of the day as buyers push prices higher.
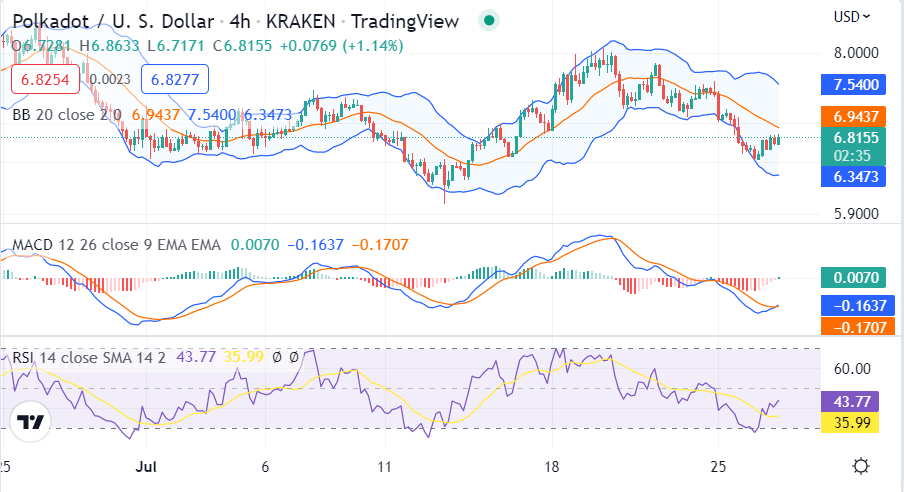 DOT/USD 4-hour price chart, source: TradingView
The Relative Strength Index for the DOT/USD pair is moving above the 50 level, which indicates that the market is in a bullish trend. The 4-hour MACD indicator shows that the market is in moving above the zero line, which indicates that the bulls are currently in control of the market. The bulls have taken control of the market as the Bollinger bands indicator are moving away from each other, which indicates that prices are likely to remain volatile in the near term.
Polkadot price analysis conclusion
To conclude, Polkadot’s price analysis shows that the market is in a strong uptrend as prices continue to make higher highs and higher lows. Bears have been losing control of the market as buyers push prices higher. The market is expected to remain volatile in the near term as the market establishes a new trading range. The investors are advised to keep an eye on the $6.86 resistance level as a break above this level could see prices surge towards the $7 mark in the near term.