Litecoin price analysis continues to be severely bearish following on from yesterday’s decline. LTC price lowered more than 7 percent over the past 24 hours to move as low as $52.66, with further downward action expected. Litecoin has faced multiple rejections around the $60 mark over the past month, with the latest retestment pulling price down almost 12 percent in 2 days. LTC bulls enjoyed a favourable start to the week as price jumped up to $59.70 on July 26, 2022. This was following a largely bullish period that began on July 13 with price at $46.65. Over the next 24 hours, LTC is expected to remain bearish with a revisit of the $50 mark.
The larger cryptocurrency market crashed further over the past 24 hours, as Bitcoin dropped below the crucial $21,000 mark with a 5 percent decline. Ethereum followed suit, dropping a significant 10 percent to move as low as $1,300. Among leading Altcoins, Cardano dropped 7 percent to $0.457, and Ripple 5 percent to $0.32. Meanwhile, Dogecoin lost 6 percent in price to lower down to $0.06 and Solana dropped 9 percent to $35.29. Polkadot also continued its extended bearish run, dropping 7 percent to $6.58.
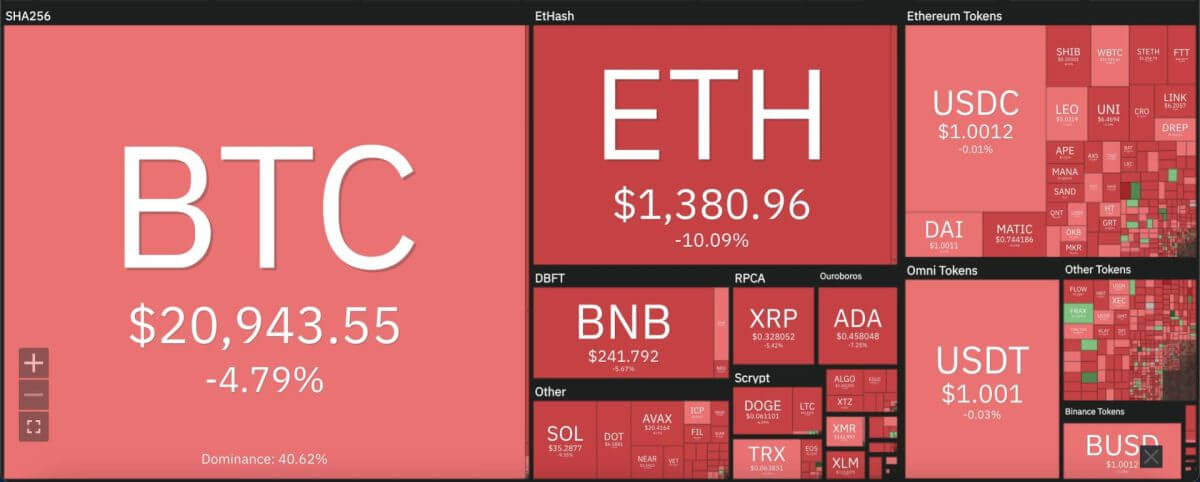 Litecoin price analysis: Cryptocurrency heat map. Source: Coin360
Litecoin price analysis: LTC drops below crucial moving averages on daily chart
On the 24-hour candlestick chart for Litecoin price analysis, price can be seen facing a severe downturn over the past 48 hours which has receded progress made over the weekend. Major technical indicators have turned bearish, with price facing an uphill battle to stay above $50 support. LTC price can be seen dropping below the 9 and 21-day moving averages on the daily chart, along with a move beneath the crucial 50-day exponential moving average (EMA) at $55.10.
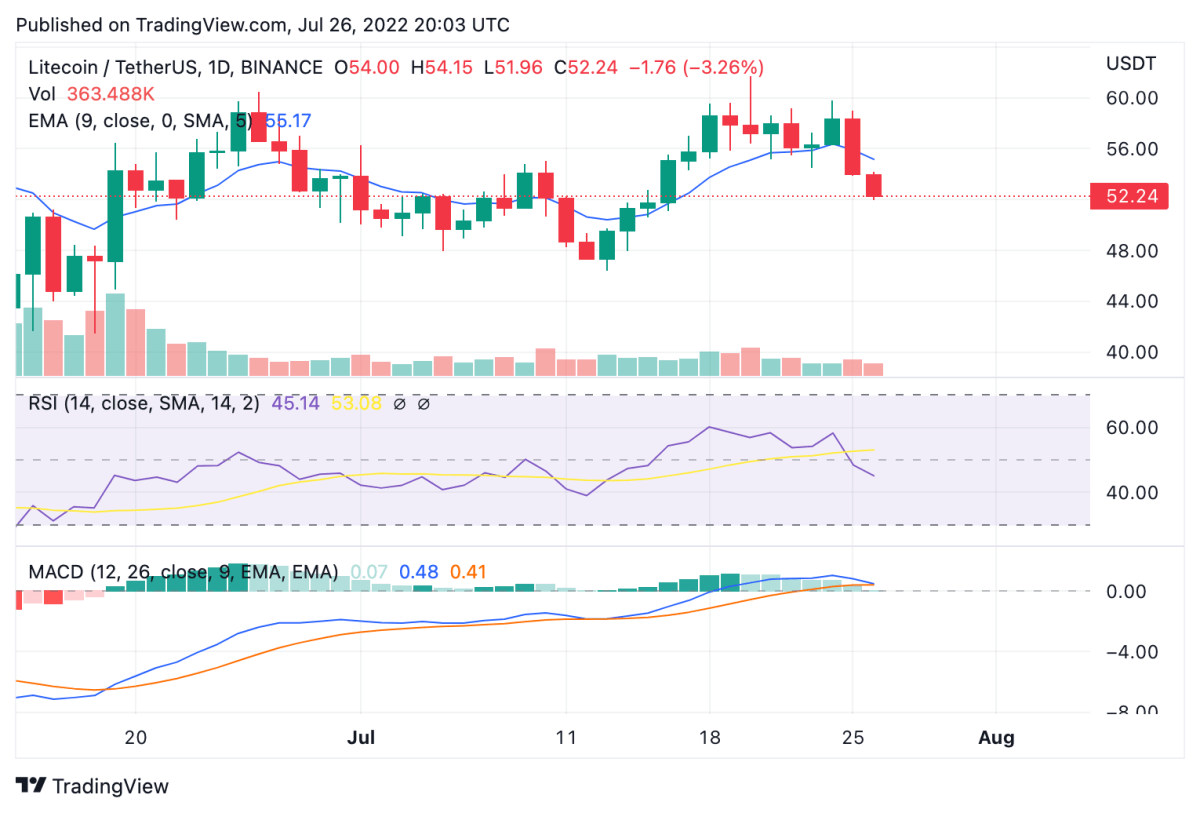 Litecoin price analysis: 24-hour chart. Source: Trading View
The 24-hour relative strength index (RSI) also presents a bearish scenario after dropping down to 45.14 after moving up to 58.23 on July 24, 2022. Trading volume has also taken a downturn over the past 24 hours, presenting further bearish evidence for LTC. Meanwhile, the moving average convergence divergence (MACD) curve can also currently be seen attempting a bearish divergence with formation of lower lows.
Disclaimer. The information provided is not trading advice. Cryptopolitan.com holds no liability for any investments made based on the information provided on this page. We strongly recommend independent research and/or consultation with a qualified professional before making any investment decisions.