Litecoin [LTC] has been building some short-term momentum over its slow recovery yesterday after a bear attack had previously stalled their early February momentum. The market is moving steadily upwards with a growth rate of 1.58% over the past 24 hours.
At the time of press, Litecoin was valued at $33.84. Over the past day, it has overtaken Tether and Bitcoin Cash and now stands fifth on the list of the world’s largest cryptocurrencies, with a market cap of $2.042 billion. LTC has a 24-hour trading volume of $667 million with the exchange a contributing a significant 8.62% of the trade via the trading pair LTC/BTC.
1-hour
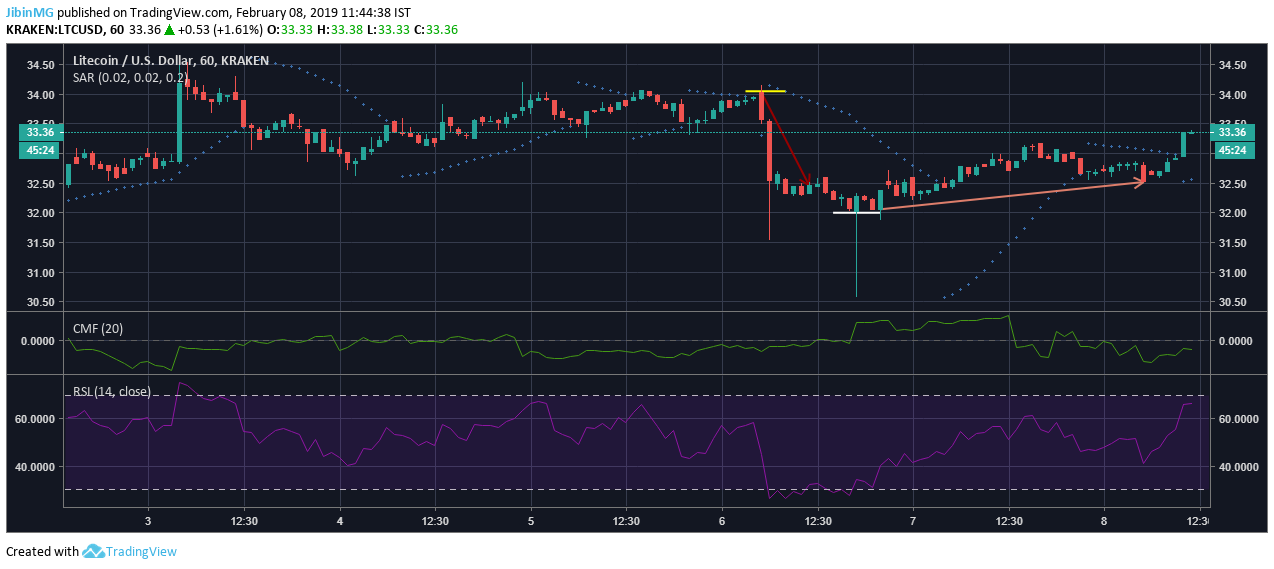
The 1-hour chart for the LTC market suggests that the bulls have managed to wrest some initiative from the bears and have posted some decent gains over the past few trading cycles. The uptrend remains minor, however, extending from $32.05 to $32.52 and is still some way from overhauling the downtrend from $34.03 to $32.44. Recent bullish activity has however breached the previous resistance point at $33.56 and now stands at $34.05. The support point remains firm at $32.00.
The Parabolic SAR indicates that after a few bearish trading cycles, the bulls have seized some control and the market has taken a bullish turn upwards.
The Chaikin Money Flow indicates that the circulation of money in the LTC market is still well below zero. However, sustained bullish activity may push it over that mark.
The Relative Strength Index indicates that the LTC market is neither overbought or oversold. However, the RSI is trending close to the 70-mark, suggesting that it’s at risk of being overbought.
1-day
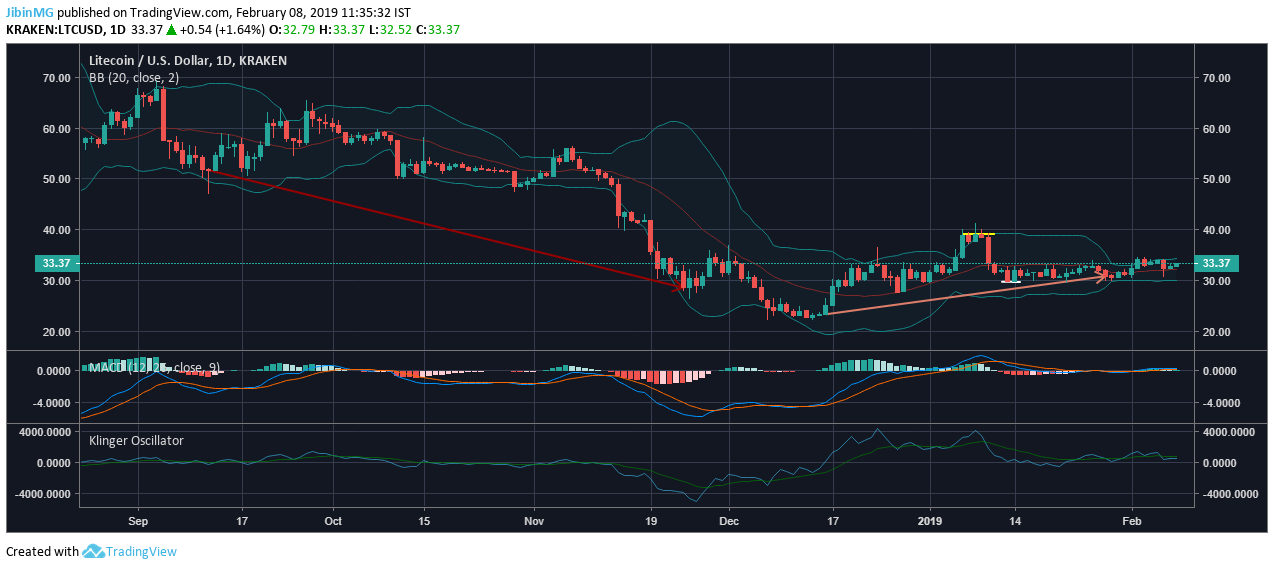
The one-day chart suggests that the market has found some stability around the $32.50-$33.50 marks. The uptrend extending from $23.38 to $30.88 has a long way to go before it corrects the downtrend from $51.71 to $28.59. Both the resistance point at $39.19 and the support point at $29.75 hold firm for the time being.
The Bollinger Bands are neither expanding or contracting at the moment. This suggests that price volatility has stabilized in the LTC market.
The MACD Index indicates that the LTC market has a bullish outlook presently.
The Klinger Oscillator, on the other hand, differs from the MACD index and suggests that the market is still under bearish control despite some bullish movement.
Conclusion
The one hour chart with indicators such as the Parabolic SAR, RSI and CMF suggest that the bulls have wrested back the initiative from the bears and that the market may soon breach its resistance points. On the other hand, the longer term, one day chart is inconclusive and its indicators such as the Bollinger Bands, MACD index and Klinger Oscillator suggest that it’s still very much a stalemate in the LTC market.