Chainlink price analysis shows that prices have formed a higher low at $6. This indicates that the bulls are in control of price action. LINK prices are facing rejection at $7.1. This is a key resistance area that the bulls need to overcome. Chainlink prices have established support at $6. This is a key level that the bulls need to protect to maintain their control over price action.
The LINK/USD currently trades at $6.76. The bulls need to push prices above $7.1 to invalidate the bearish trend and establish a new bullish trend. If the bulls can do this, we could see LINK prices rally towards $8.
On the downside, Chainlink prices have established support at $6. A break below this level could see LINK retest the $5.8 support area. Chainlink (LINK) price analysis shows that prices face rejection at $7.1 as bulls try to resume the uptrend. The 4-hour chart shows that Chainlink prices have formed a higher low at $6, indicating that the bulls are in control of price action.
Chainlink price analysis shows that the pair is currently trading at $6.76, and the bulls need to push prices above $7.1 to invalidate the bearish trend and establish a new bullish trend.
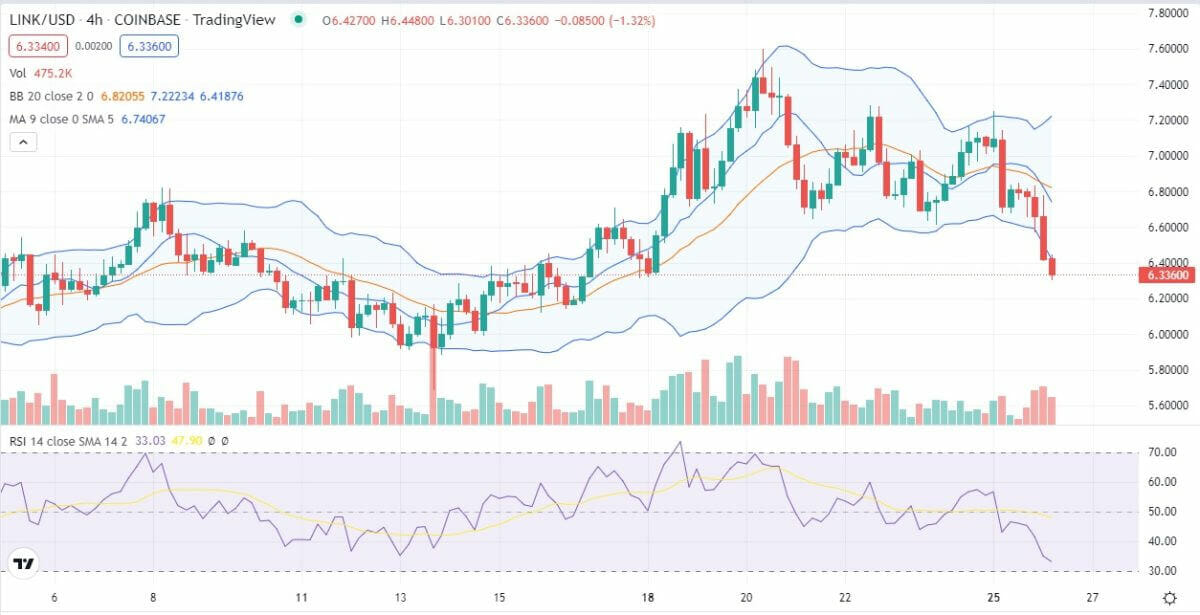
LINK/USD 4-hour price analysis: Recent developments
The price chart for Chainlink, created using a 4-hour time frame, shows that the token has been on an upwards trend for the previous four hours and has formed higher lows and higher highs. The token has also burst out of the ascending channel to the upside, considered a positive indication. Prices have, however, retracted back into the channel.
 Source: TradingView
The LINK/USD pair is trading in a broadening wedge pattern, considered a bullish signal. The relative strength index is presently at overbought levels, suggesting that the prices are overextended in the near term. However, the MACD indicator remains in bullish territory and is gaining momentum. The 50-day moving average has flattened out, but the 200-day moving average slope upward suggests that the long-term trend is still positive.
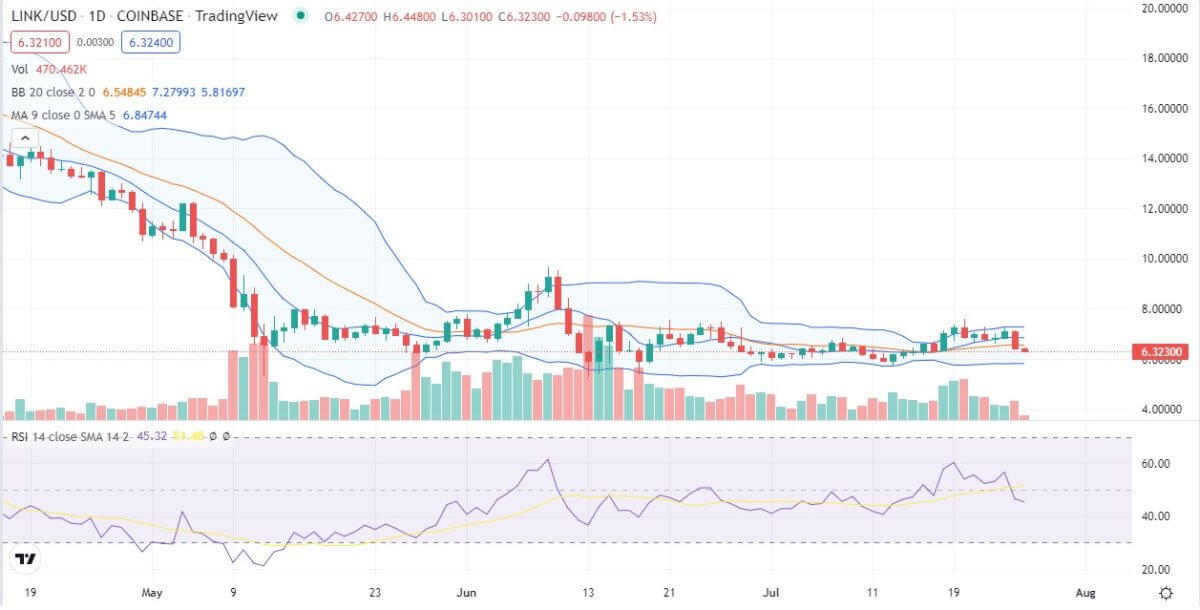
Chainlink price analysis for 1-day chart: LINK/USD faces resistance at $7.1
On the daily Chainlink price analysis chart, the LINK/USD pair is trading within an upper and lower range, with prices fluctuating between the 6.64 and 7.07 levels of support and resistance. During the early hours of today, the currency rose to a high of $7.20, but it was soon confronted by resistance and reversed back to its current position.
 Source: TradingView
The short-term technical analysis of Chainlink indicates that the token is in a strong upward trend, with higher highs and higher lows over the past 24 hours. Prices are currently facing resistance at $7.07, the highest peak of the rising channel.
The RSI is currently trading at 50.1, which suggests that the market is neither overbought nor oversold. The MACD indicator is also trading in bullish territory and is presently making higher highs, indicating that the bulls are in control of price action. The most important support level to watch out for is $6.64, the lower end of the rising channel.
Chainlink price analysis conclusion
Overall, Chainlink price analysis reveals that the short-term and long-term technical analysis for Chainlink points to a bullish trend. Prices are currently facing rejection at $7.07, which is the upper end of the rising channel. The bulls need to push prices above this level to invalidate the bearish trend and establish a new bullish trend.
Disclaimer. The information provided is not trading advice. Cryptopolitan.com holds no liability for any investments made based on the information provided on this page. We strongly recommend independent research and/or consultation with a qualified professional before making any investment decisions.