Polkadot price analysis shows that the bulls have controlled DOT’s price since early September. The market has seen a series of higher highs and higher lows, indicating that the bulls control DOT’s price. Recently, DOT prices have been consolidating between $6.42 and $7.2.
The Relative Strength Index (RSI) is currently above 50, indicating that the bulls are controlling DOT’s price. However, if DOT prices fall below $6.61, it would indicate that the bears have taken control of the market. DOT/USD currently trades at $6.72 and faces resistance at $8.2.
DOT’s price has been on a tear since early September, as the market has seen a series of higher highs and higher lows. The bulls seem to control DOT’s price as the Relative Strength Index (RSI) is currently above 50. However, if DOT prices fall below $6.61, it would indicate that the bears have taken control of the market.
DOT/USD 1-day price analysis: The bulls are still in command
The 24-hour Polkadot price analysis chart shows that the bulls and the bears are currently battling for control of DOT’s price. The market is currently trading between $6.72 and $7.2, with both sides seemingly unable to gain an advantage.
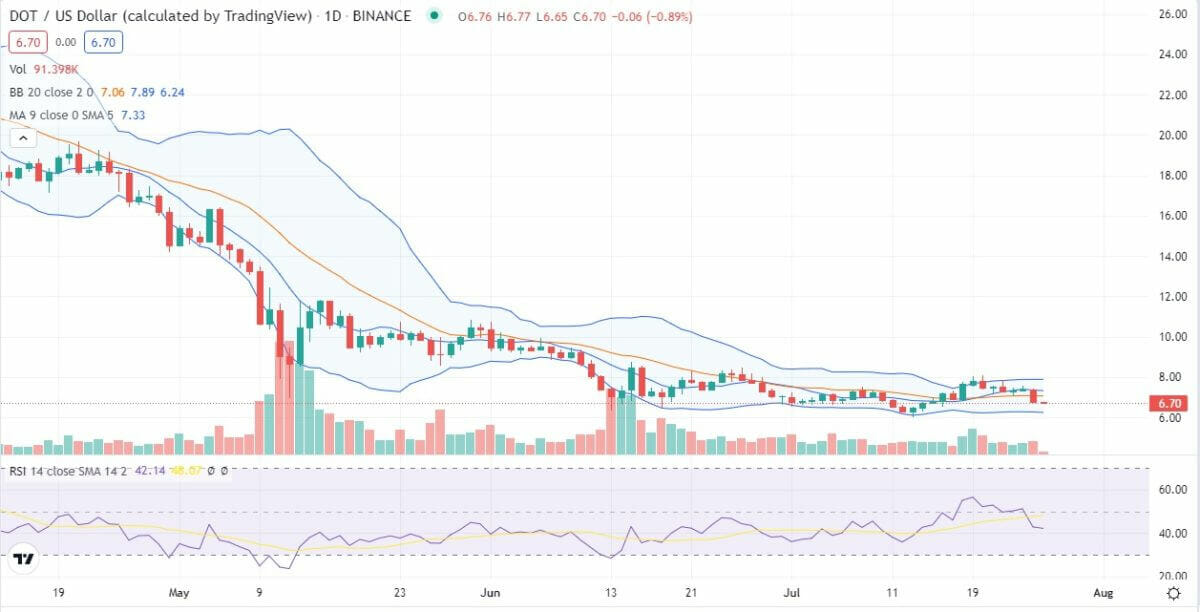 Source: TradingView
The Moving Average Convergence Divergence indicator suggests that the upswing will continue as the MACD line is above the signal line. The Relative Strength Index is approaching overbought levels, implying that prices may drop soon, as long as prices are trading above $6.26.
DOT/USD 4-hour price analysis: Recent price developments
The 4-hour Polkadot price analysis chart shows that DOT’s price has formed a descending triangle pattern. This pattern is typically bearish and may lead to a breakdown in DOT’s price if prices fall below $6.61.
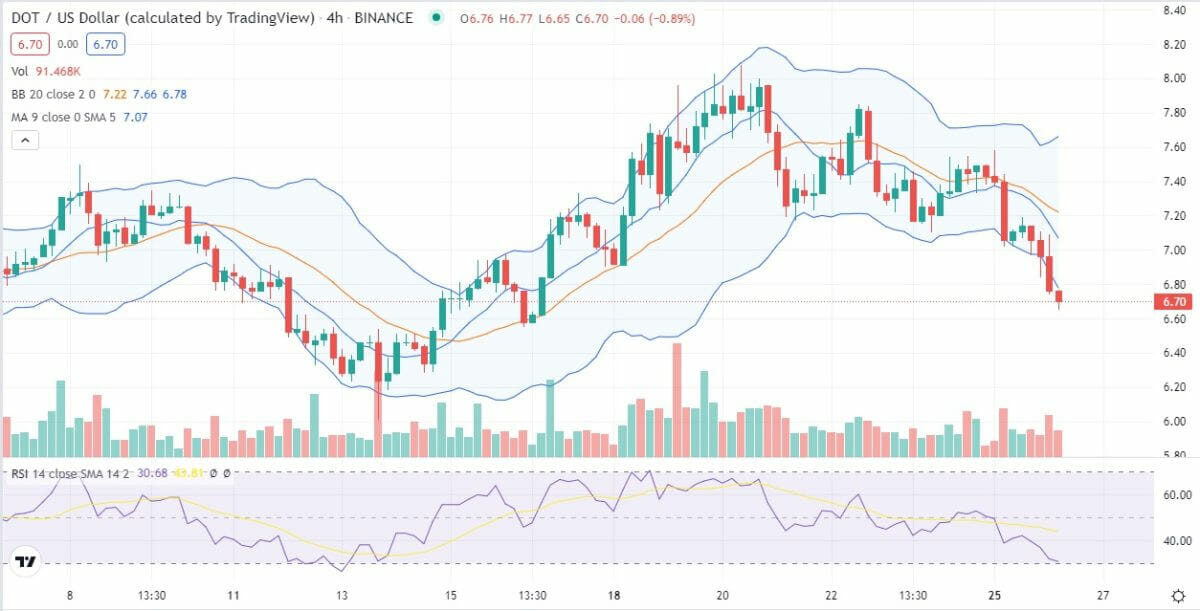 Source: TradingView
The DOT/USD intersects the Relative Strength Index on the north side, which implies that the bulls are in command. The MACD indicator is near the signal line, and a crossover may lead to prices targeting $6.80. The 50-period EMA is trading sideways, suggesting that the prices will likely remain range-bound for the next few days, while the 20 EMA is currently at $6.44, providing strong support.
Polkadot price analysis: Conclusion
According to our Polkadot price analysis, DOT will likely continue its uptrend as the market sentiment turns positive. Investors are eyeing the $7.63 resistance level to get into new positions. The DOT/USD technical analysis suggests that the prices are in a strong upward trend and that a breakout above $7.63 might bring it toward the $8 level in the short term.
Disclaimer. The information provided is not trading advice. Cryptopolitan.com holds no liability for any investments made based on the information provided on this page. We strongly recommend independent research and/or consultation with a qualified professional before making any investment decisions.