Avalanche price analysis shows that the AVAX/USD pair is currently in strong bullish market sentiment. Prices are facing resistance at the $24.22 level and critical support is seen at the $22.89 level. A break below this support could see prices retrace back to the $20.00 level. The AVAX/USD pair is currently trading at the $24.00 level after a strong rally from the $22.50 level. The market sentiment is currently bullish, however, prices are facing some resistance at the $24.22 level. A break above this resistance could see prices test the $25.00 level.
The price has increased by 2.03 percent in the last 24 hours and is currently trading at $24.22, the price opened today trading at $23.0 but the bull run was short-lived as the price corrected higher to reach the current level.The 24-hour volume traded is $449,830,521and the total market cap of Avalanche is now $6,825,394,382.
AVAX/USD 1-day price chart: Bulls continue to push prices higher as altcoin hits $24.00
The 1-day Avalanche price analysis shows that the market has been in a strong uptrend since early today as it climbed from $23.0 to the current high at $24.22. AVAX prices have been stuck in a tight range between $20.00 and $25.00 for the past few days as bulls and bears battle for control of the market. The bulls have been able to push prices higher today, however, they are facing some resistance at the $24.22 level which is the next major level of resistance.
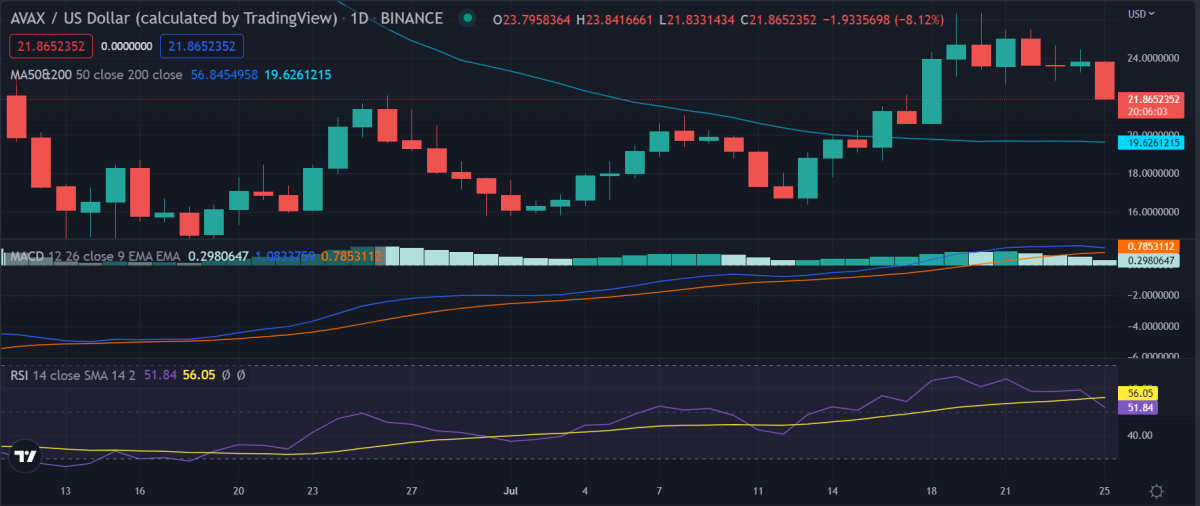
The 50 -day moving average is currently flat and the 200-day moving average is still rising which indicates that the long-term trend is still bullish. The RSI is currently above 50 which indicates that the market has some room to move higher before becoming overbought. The MACD line (blue) is currently above the signal line (red) which indicates that the market is in a strong uptrend.
AVAX/USD analysis on a 4-hour price Chart: AVAX/USD trades above $24.00
On the 4-hour chart, we can see that the market has formed an ascending parallel channel and is currently trading at the upper boundary of the channel. Prices have recently broken out of a symmetrical triangle pattern which is a bullish sign. The market is expected to retrace back to the $23.60 level before resuming its upward move. The bears will be looking to take control of the market if prices break below the $22.89 level.
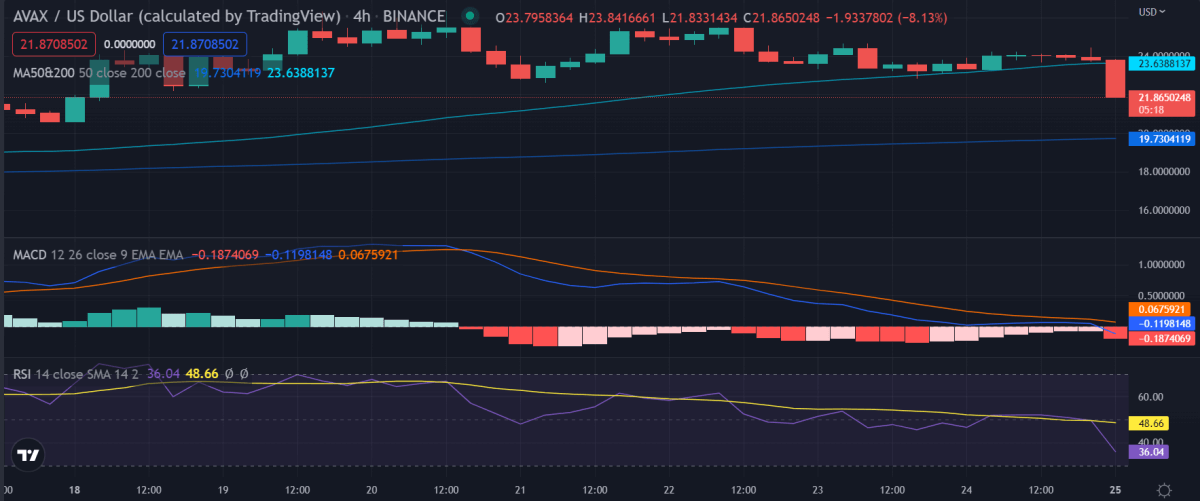
The RSI on 4-hour is currently at 63 which is in the overbought region and indicates that the market might be due for a correction. The MACD line indicator is currently above the signal line which indicates that the market is in a strong uptrend but is losing momentum. The 50-Moving average and 200-moving averages are both still rising which indicates that the long-term trend is still bullish.
Avalanche price analysis conclusion
To conclude, Avalanche price analysis shows that the market is in a bullish trend as the price is expected to surge higher in the coming days. The market will find it difficult to sustain these levels, however, the overall market sentiment is bullish. As long as the prices stay above the key support level of $22.89, we can expect further upside in the AVAX prices. Technical indicators are in favor of the bulls, which indicates that further upside is possible in the short term.
Disclaimer. The information provided is not trading advice. Cryptopolitan.com holds no liability for any investments made based on the information provided on this page. We strongly recommend independent research and/or consultation with a qualified professional before making any investment decisions.