The Trust Wallet (TWT) prices jump above the 100-day SMA and break the triangle pattern in the daily chart. Will the breakout rally cross above the $1 mark?
Key Technical Points:
- The TWT prices jumped by 8.1% in the last 24 hours.
- The market value of Trust Wallet breaks above the 100-day SMA.
- The 24-hour trading volume of Trust Wallet Token is $409 million, indicating a hike of 38%.
Past Performance of TWT
As mentioned in our previous analysis, the falling channel breakout rally drives the Trust Wallet token (TWT) prices to the 100-day SMA. The breakout rally forms a symmetrical triangle pattern in the daily chart. How about the 10% jump in the last two days from the 100-day SMA results in the bullish breakout of the resistance trendline. 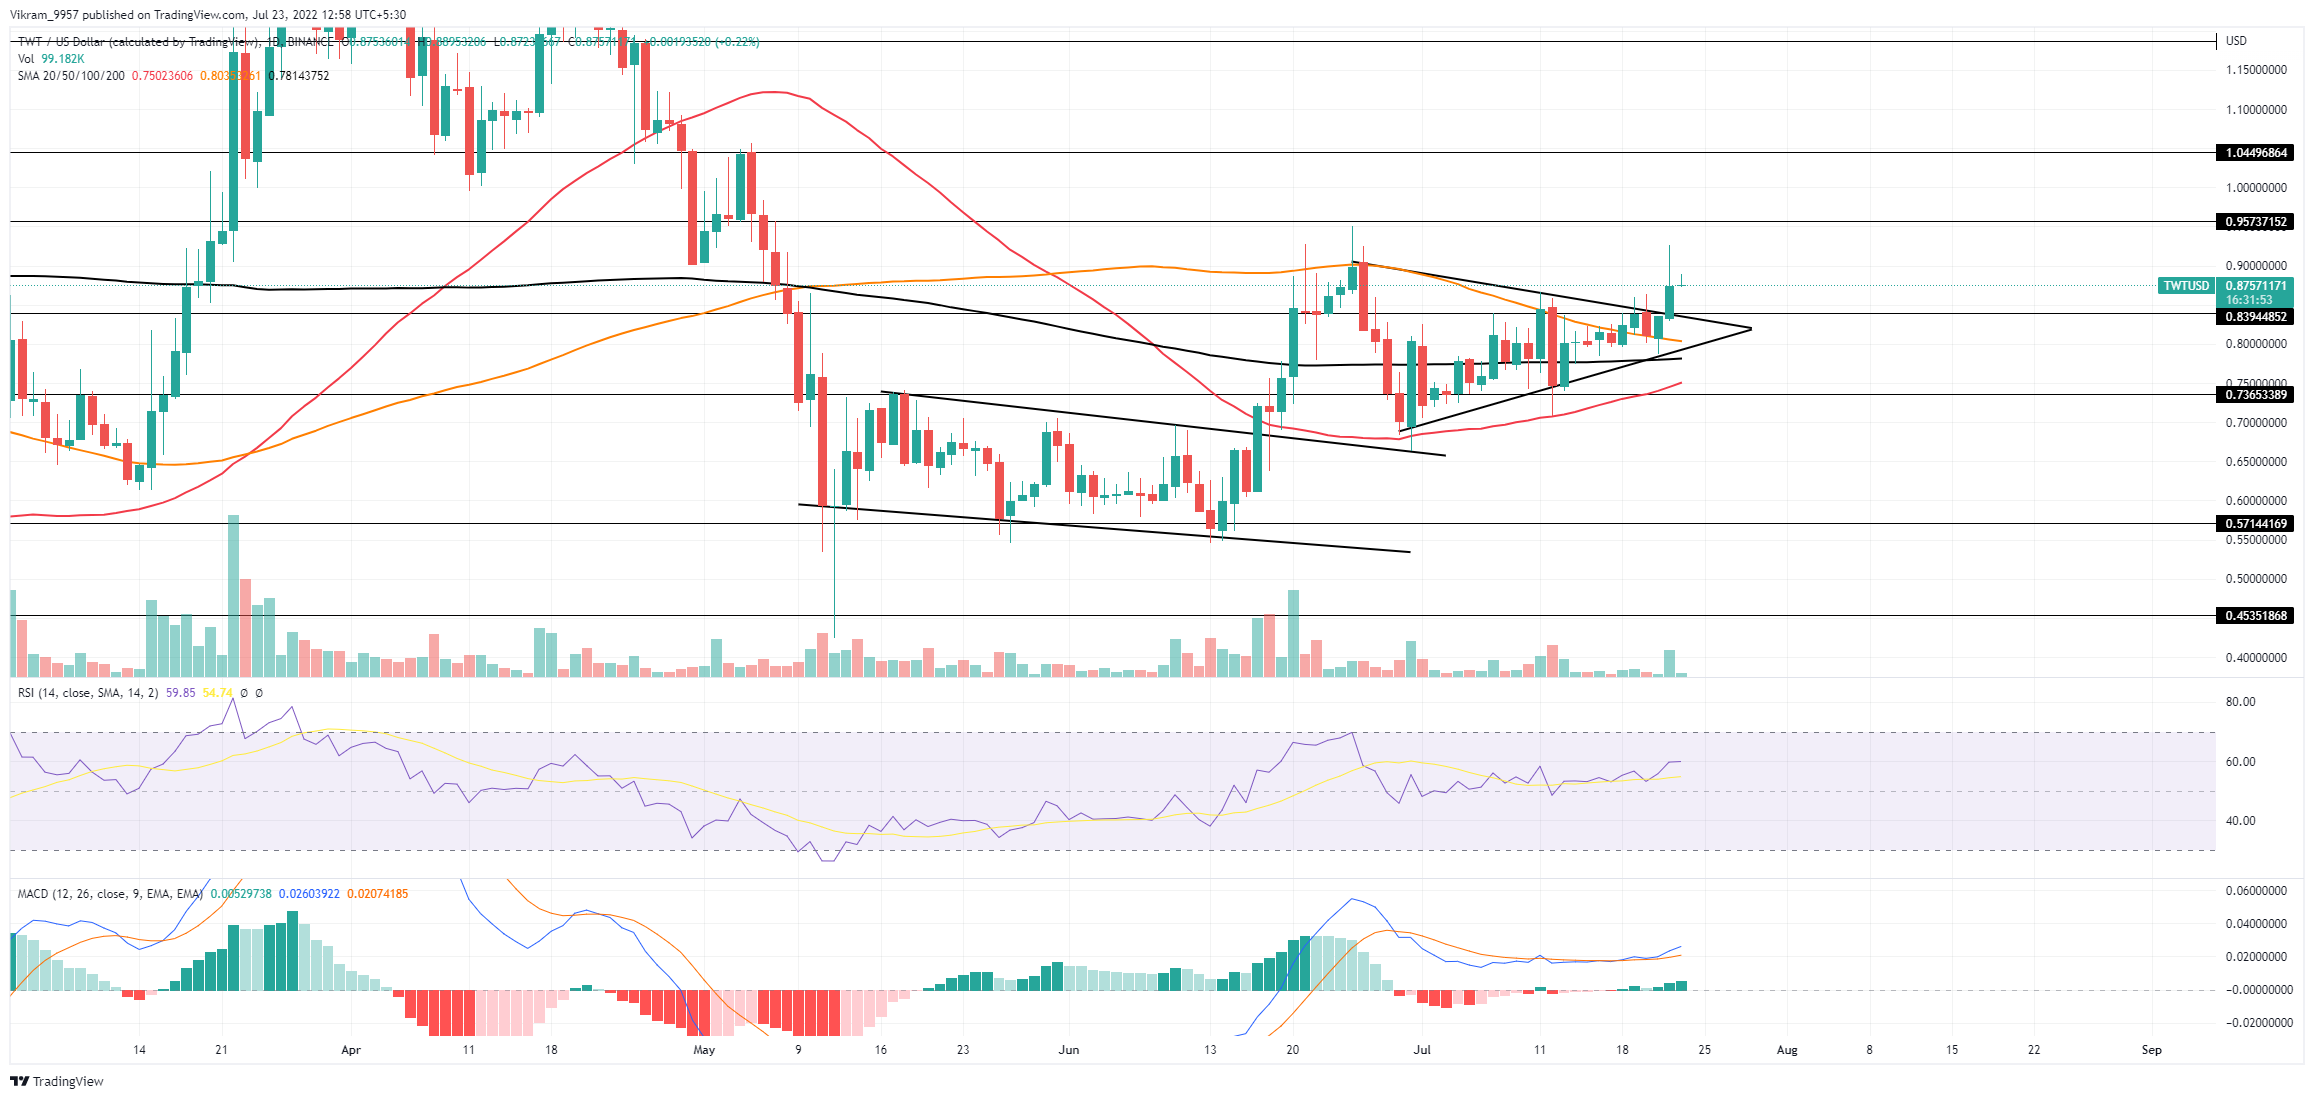 Source - Tradingview
TWT Technical Analysis
The current market price of TWT trades higher above all the crucial SMAs in the daily chart, and the triangle breakout rally teases an uptrend continuation. Hence, traders can find multiple entry spots with growth potential to the next psychological mark of $1. The RSI and MACD indicators regained the bullish bias after a long-term neutral sideways trend when the prices were trapped within the symmetrical triangle pattern. The RSI slope reverses higher within the nearly overbought zone after a long sideways trend at the halfway line. The MACD and signal lines regain the balanced alignment after the lateral movement of mixed signals. In a nutshell, the TWT technical analysis displays a higher likelihood of an uptrend continuation to the $1 mark.
Upcoming Trend
If the breakout rally gains momentum, the TWT market price will skyrocket to the $1 mark. However, a retest of the bullish breakout might result in a price dump to the broken resistance trendline close to $0.80. Resistance Levels: $0.95 and $1.05 Support Levels: $0.80 and $0.73