NEXO is a lending platform, built on blockchain technology. NEXO is capable of lending you money backed by cryptocurrencies. For passing on the loan in the form of fiat currency or stable coins, they accept tokens such as Bitcoin (BTC), Ethereum (ETH), Litecoin (LTC), and Ripple (XRP). Let us look at the technical analysis for NEXO.
Past Performance
On June 26, 2021, NEXO opened at $1.39. On July 02, 2021, NEXO closed at $1.50. Thus, in the past week, the NEXO price has increased by approximately 7.91%. In the last 24 hours, NEXO has traded between $1.32 – $1.55.
https://www.tradingview.com/x/ujDs3LPh/
Day Ahead And Tomorrow
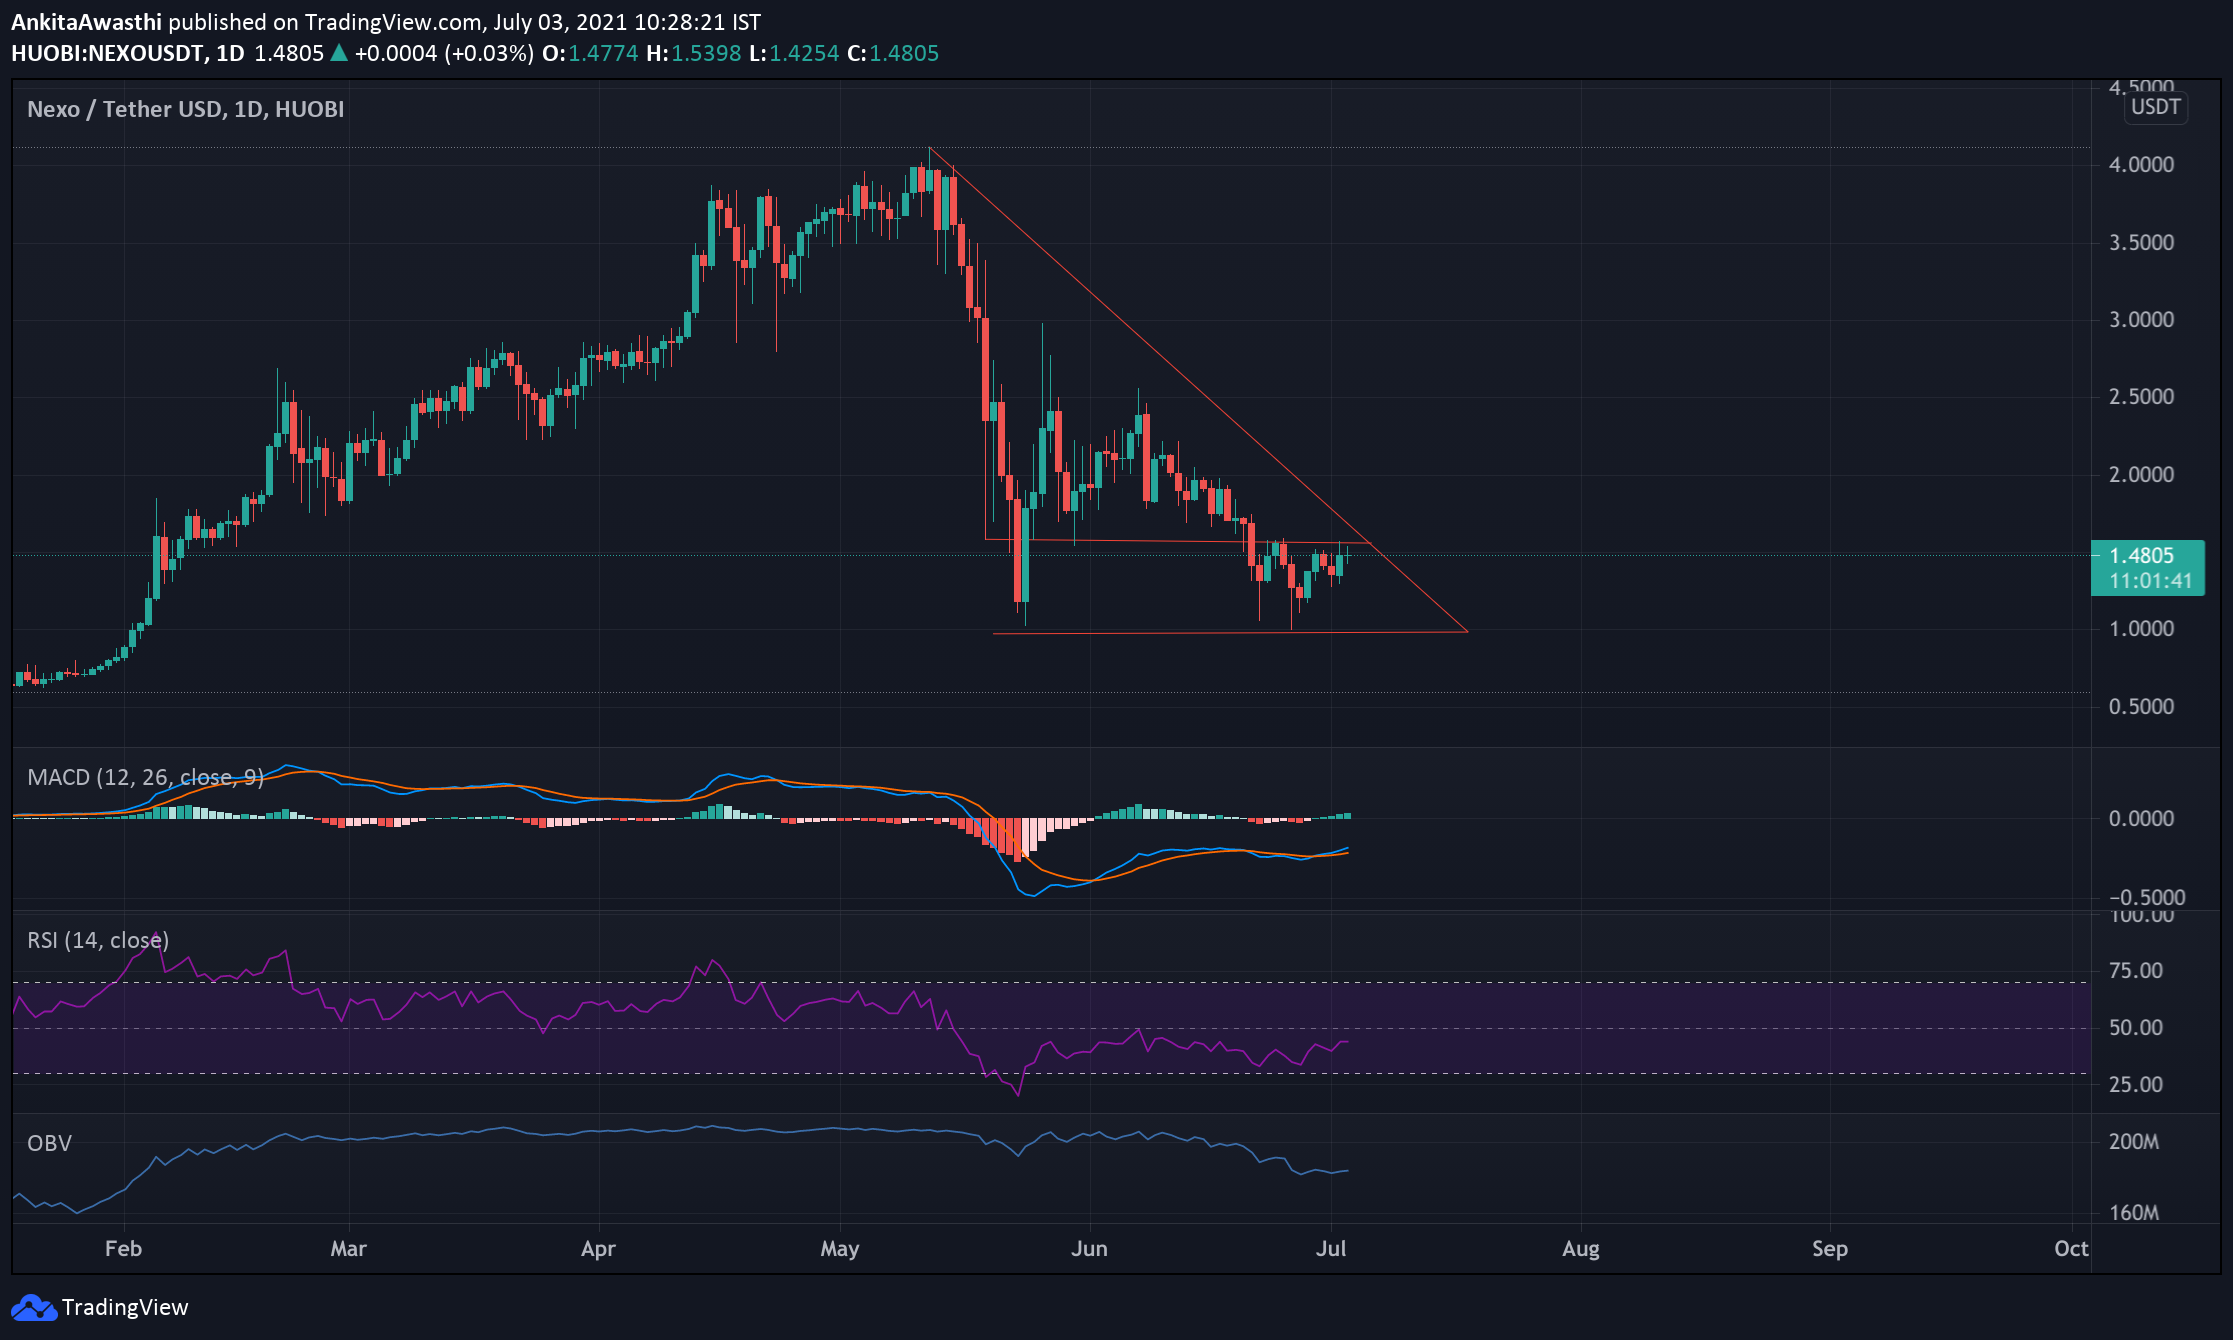
Currently, NEXO is trading at $1.48. The price has increased from the day’s opening price of $1.45. Thus, the buying pressure in the market seems high.
The MACD and signal lines are negative. However, a bullish crossover by the signal line over the MACD line has occurred. But, the overall market momentum is bearish. Hence, the price may rise at a slower pace.
Currently, the RSI indicator is at 43.15%. It faced rejection at 33% and rose to this level. Thus, buying pressures are slowly mounting. We have to wait and watch if buying pressures become strong enough to bring about a trend reversal for NEXO.
The OBV indicator is downward sloping. Thus, selling volumes are higher than buying volumes. High selling activity will exert downward pressure on the NEXO price.
In short, when we look at all three oscillators, we can say that the price may continue to fall if the price does not break the resistance level of $1.55. However, we cannot rule out the possibility of a trend reversal. We have to wait and watch to see if an intermittent price rise is a corrective action or the beginning of a positive trend.
NEXO Technical Analysis
Currently, the price is below the second Fibonacci pivot point of $1.50. If the bears remain strong till day end, then the price is likely to fall below the first, second, and third support levels of $1.47, $1.28, and $1.11, respectively.
The price has tested and fallen below the 23.6% FIB retracement level of $1.50. It may soon fall below the support level of $1.28. Thereafter, we have to wait and watch if the price retests and breaks out of these levels. In that case, the price upswing is likely to continue tomorrow as well.