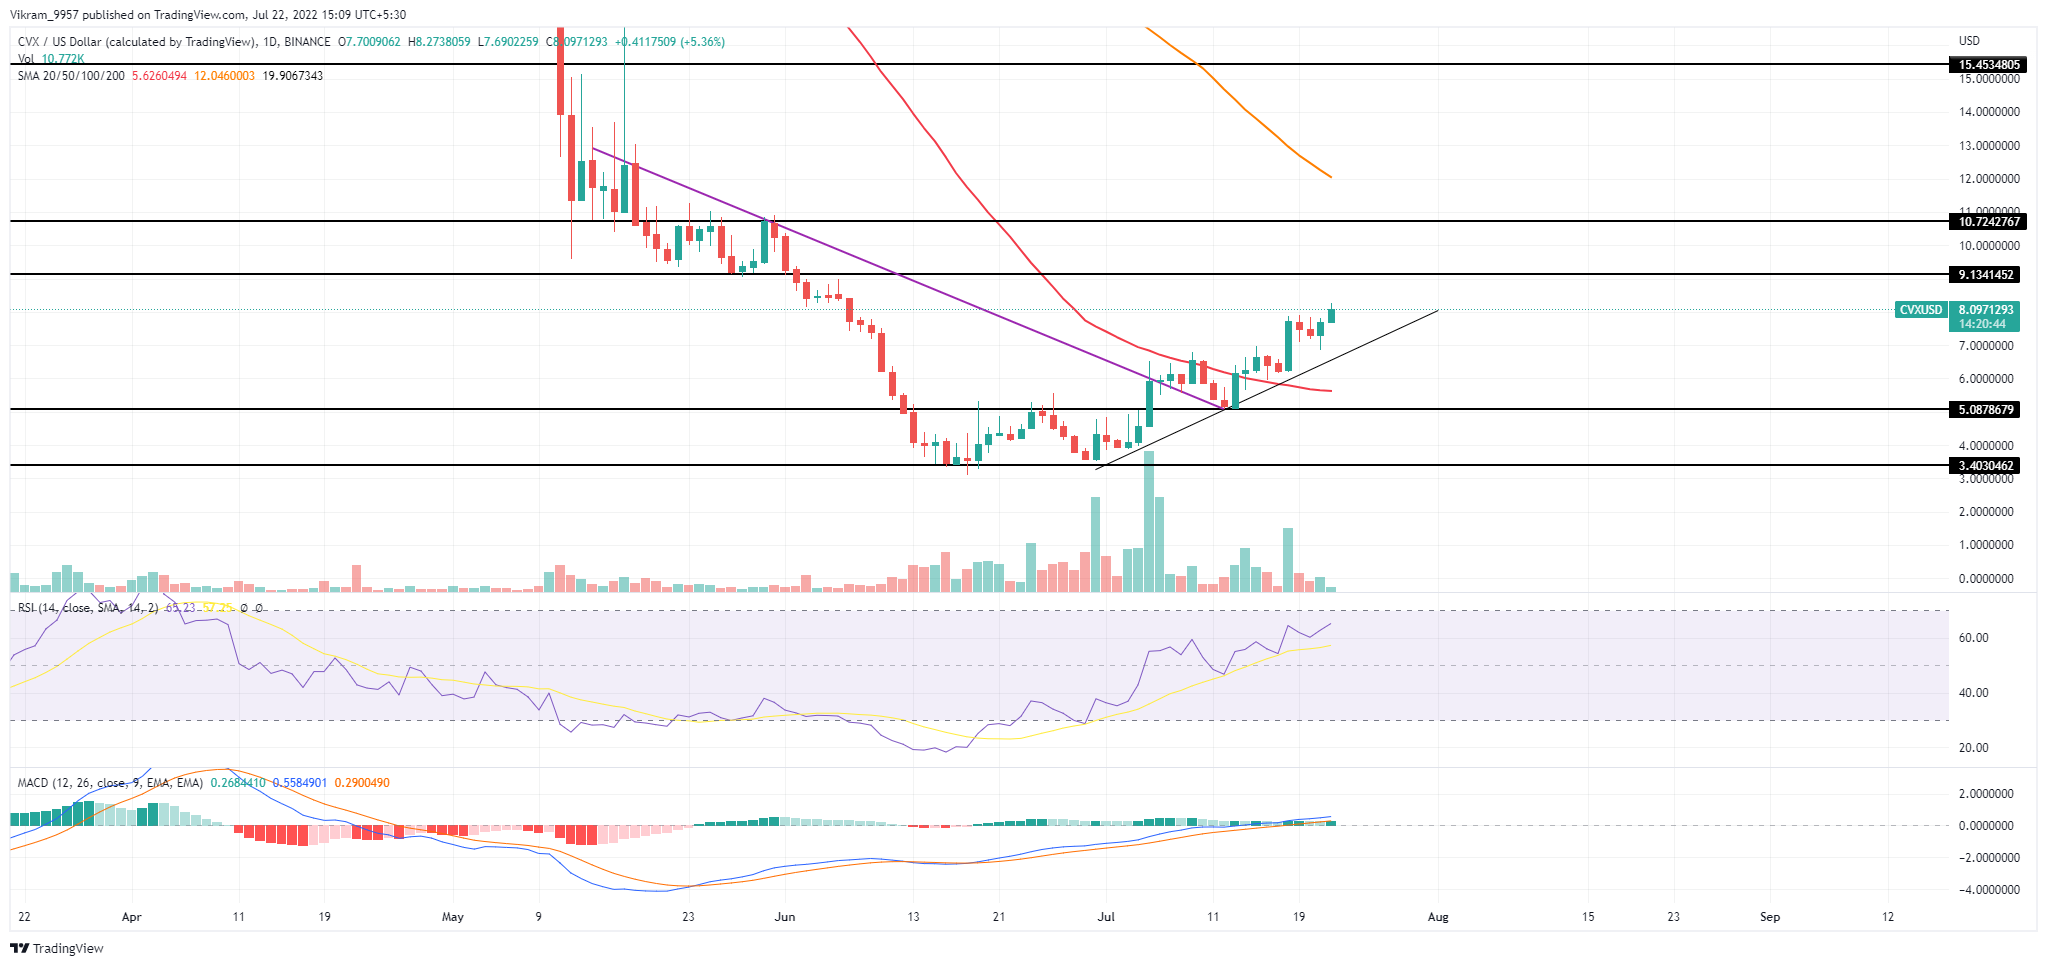
The Convex Finance (CVX) prices showcase a bullish reversal from the support trendline, ready to overpower the selling pressure at $9.
Key Technical Points:
- The CVX prices jumped by 14.48% in the last 24 hours.
- The market value of Convex Finance sustains above the support trendline.
- The 24-hour trading volume of Convex Finance is $19.88 Million, indicating a hike of 23%.
Past Performance of CVX
The Convex Finance (CVX) price action shows a bullish reversal from the $3.40 mark and accounts for a 135% jump in the last month. As a result, the bull run exceeds the $8 mark and the 50-day SMA resulting in the formation of a support trendline. Furthermore, as we mentioned in the previous analysis, the prices sustain above the trendline and prepare to challenge the $9 mark.  Source - Tradingview
CVX Technical Analysis
The Convex Finance (CVX) prices show the daily candle acting as the follow-through candle of the long-wick candle formed at the support trendline. Hence, traders can find entry opportunities at current market prices to ride the uptrend. The RSI indicator reflects a continuous increase in the underlying bullishness with no signs of any bearish divergence. Hence, the indicator demonstrates a high likelihood of a bull run to the $9 mark. Furthermore, the MACD indicator reflects a gradual growth in buying price as the fast and slow lines rise higher in the positive zone. Hence, the momentum indicators support the price action analysis of the trendline breakout. In a nutshell, the CVX technical analysis projects a high likelihood of an uptrend to the $9 mark.
Upcoming Trend
If the bull run for Convex Finance (CVX) continues this week, the prices will break the $9 mark. Hence, traders can expect the breakout rally to reach the $10 mark. Resistance Levels: $9 and $10 Support Levels: $7 and $6
 cryptoknowmics.com