Avalanche price analysis shows that AVAX prices have been on a bullish run in the past 24 hours. The market sentiment remains bullish as prices continue to remain above $24.29. AVAX prices have seen a slight pullback in the past few hours, however, the overall market sentiment remains bullish. Prices are currently trading just below the resistance level of $24.36. Key support levels to watch out for are $22.29. A break below either of these levels could signal a change in the market sentiment.
The digital asset market has been on a tear lately with other major cryptocurrencies all hitting new all-time highs. AVAX prices have been stuck in a tight range between $22 and $24 for the past few days as the 24-hour trading volume is currently at $1943,131,012. The total market capitalization is currently at $6,895,132,586 as the digital asset remains in the top 30 largest cryptocurrencies by market cap.
AVAX/USD 1-day price chart: Bullish momentum builds
The 1-day Avalanche price analysis shows that the market has been in a strong uptrend since early today as the price surged from $21.50 to reach the current high of $24.37. The market is currently facing resistance at the $24.36 level. If the price can break above this level, it could move towards the $25 region. On the other hand, if the price fails to break above this level, it could correct lower towards the $22.29 support level.
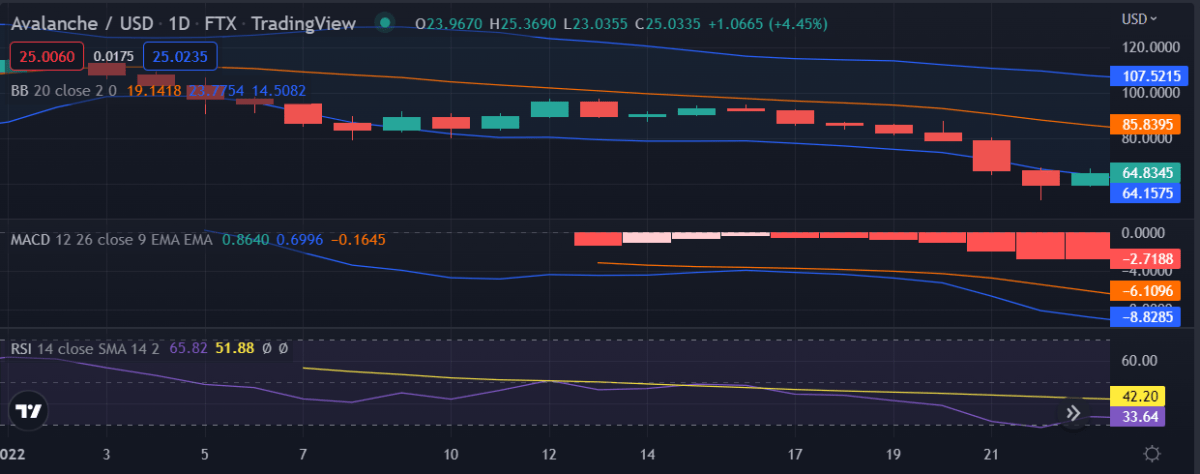 AVAX/USD 1-day price chart, source: Tradingview
The RSI indicator remains well above the 70 level which signals that the bulls are still in control of the market. The MACD indicator is currently in a strong bullish momentum as the MACD line (blue) is well above the signal line (red). The Bollinger band has also been breached to the upside which signals that the bulls are in control of the market.
AVAX/USD analysis on a 4-hour price Chart: Ascending parallel channel
The 4-hour Avalanche price analysis shows that the market has been in an ascending parallel channel for the last 4-hours. The market recently broke out of this channel to the upside which signals that the bulls are in control of the market. The bears are currently trying to push the prices back into the channel. If they are successful, the price could correct lower towards the $22.29 support level.
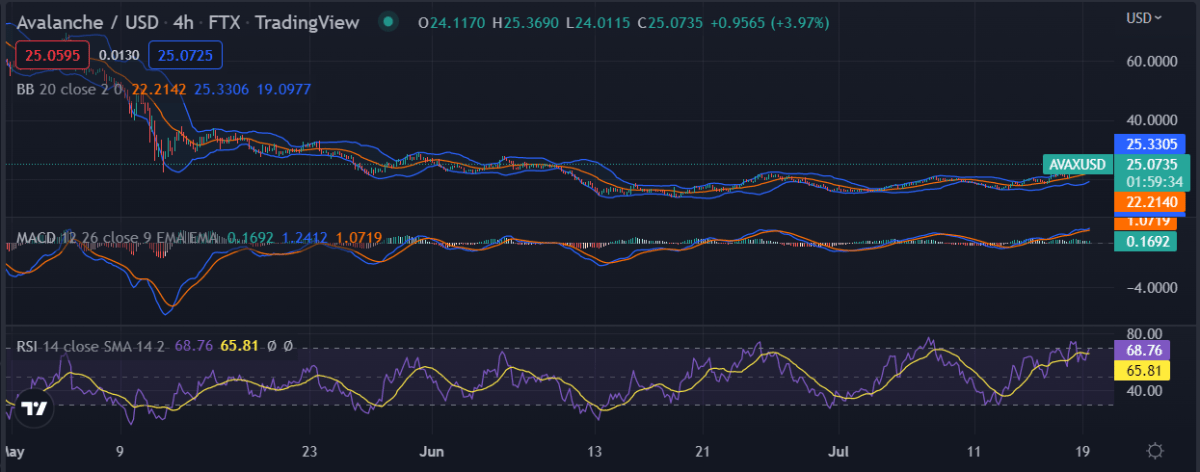 AVAX/USD 4-hour price chart, Source: Tradingview
The MACD on the 4-hour chart is giving a mixed signal as the MACD line (blue) and the signal line (red) are close to each other. The RSI indicator is currently at the 63 level which signals that the market has room to move higher. The Bollinger band on the 4-hour chart is moving above the candlesticks which signals that the market is in bullish momentum.
Avalanche price analysis conclusion
To conclude, Avalanche price analysis shows that the market is in a bullish trend as the price is expected to surge higher in the coming days. The market will find it difficult to sustain these levels, however, the overall market sentiment is bullish. As long as the prices stay above the key support level of $22.29, we can expect further upside in the AVAX prices. Technical indicators are in favor of the bulls, which indicates that further upside is possible in the short term.
Disclaimer. The information provided is not trading advice. Cryptopolitan.com holds no liability for any investments made based on the information provided on this page. We strongly recommend independent research and/or consultation with a qualified professional before making any investment decisions.