- Ripple price topped near the $0.3425 level and later declined sharply against the US dollar.
- There is a crucial bearish trend line formed with resistance at $0.3350 on the 4-hours chart of the XRP/USD pair (data source from Poloniex).
- The pair could accelerate losses if there is a downside break below the $0.3000 support level.
Ripple price revered most of this past week’s gains and moved below $0.3200 against the US Dollar. XRP is likely to decline further below $0.3000 and $0.2920 in the coming days.
Ripple Price Analysis
This past week, there was a solid upward move above the $0.3250 resistance in ripple price against the US Dollar. The XRP/USD pair even spiked above the $0.3400 resistance before sellers emerged near the $0.3420 level. The price topped near the $0.3425 level and later started a sharp decline. It broke many supports such as $0.3250, $0.3140 and $0.3115. Moreover, there was a break below the 61.8% Fib retracement level of the last wave from the $0.2854 low to $0.3426 high. Finally, there was a close below the $0.3100 level and the 55 simple moving average (4-hours).
Similarly, there were bearish moves in bitcoin, Ethereum, EOS, TRX and bitcoin cash. The recent decline in ripple was protected by the 76.4% Fib retracement level of the last wave from the $0.2854 low to $0.3426 high. Additionally, the previous support at $0.3010 and bullish trend line are protecting losses. Should there be a downside break below $0.3000, the price could decline towards the $0.2920 or $0.2880 support levels. On the upside, an initial resistance is near the $0.3100 level and the 55 simple moving average (4-hours). Above $0.3100, the price may test the $0.3140 resistance. There is also a crucial bearish trend line formed with resistance at $0.3350 on the 4-hours chart of the XRP/USD pair.
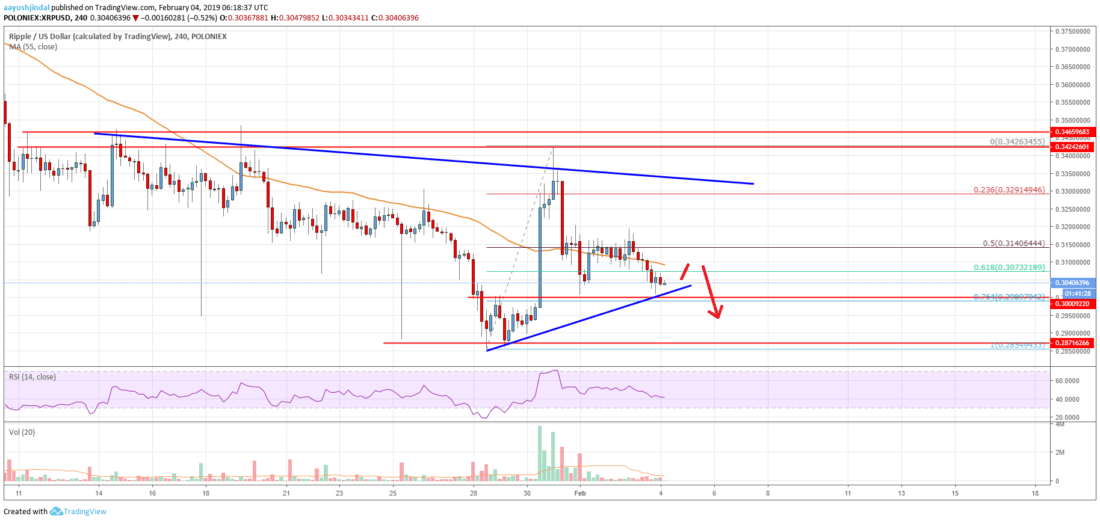
Looking at the chart, ripple price is clearly under pressure below $0.3140. If sellers gain pace below $0.3000, the price may accelerate below $0.2920.
Technical indicators
4-hours MACD – The MACD for XRP/USD is back in the bearish zone.
4-hours RSI (Relative Strength Index) – The RSI for XRP/USD is currently just above the 40 level.
Key Support Level – $0.3000
Key Resistance Level – $0.3140