Uniswap price analysis reveals that the market is currently following a massive downwards trend below the $7.2 mark and is likely to decline even further. UNI/USD had tremendous momentum the previous day, July 16, 2022, when the price went significantly from $7.6 to $7.2. However, the cryptocurrency continued to decline today, on July 17, 2022, showing solid bearish momentum; currently, the price of UNI is available at $7.03. Uniswap is down 3.75% in the last 24 hours, with a trading volume of $165,502,040 and a live market cap of $5,142,473,061. UNI ranks at #17 in the cryptocurrency rankings.
UNI/USD 4-hour price analysis: Latest developments
Uniswap price analysis indicates that market volatility follows a significantly decreasing trend, making Uniswap prices less vulnerable to volatile changes on either extreme. The upper limit of the Bollinger’s band is available at $7.4, which acts as the most substantial resistance for UNI. Conversely, the lower limit for the Bollinger’s band is available at $6.5, which serves as a point of support for UNI.
The UNI/USD price appears to be crossing under the curve of the Moving Average, signifying a bearish trend. Furthermore, the UNI/USD price path is moving upwards, attempting to cross the moving average a second time, indicating bullish and potential reversal opportunities.
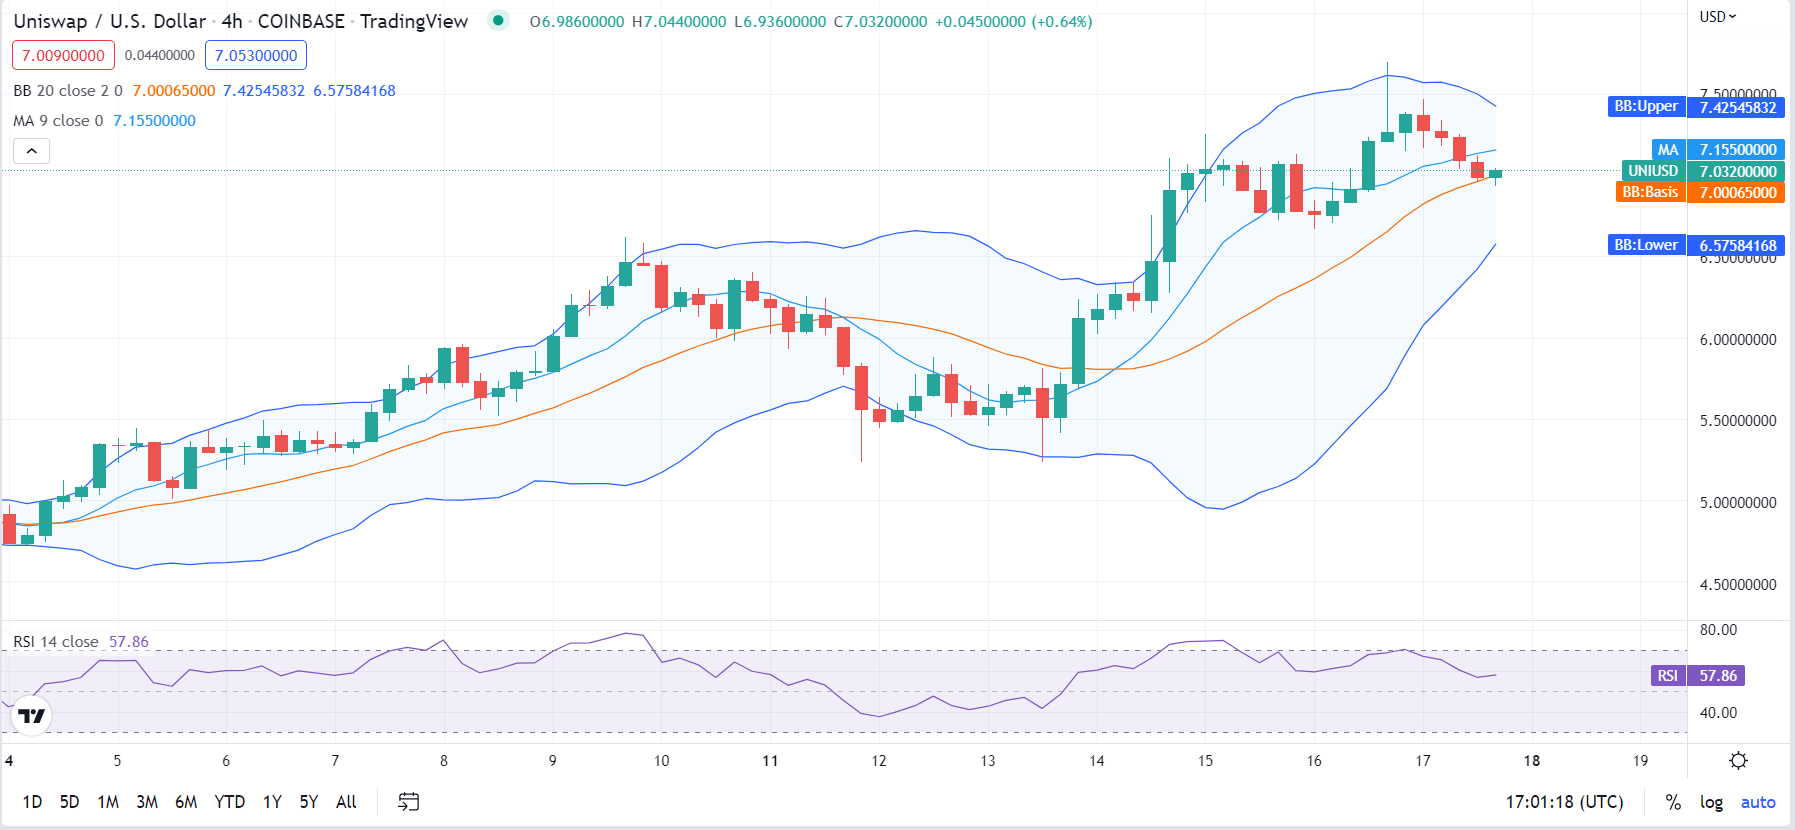
Uniswap price analysis reveals that the Relative Strength Index (RSI) is 57, meaning UNI/USD is stable and falls in the upper-neutral region. The RSI score appears to be following an upward movement signifying an increasing market trend towards further increase. The RSI score increases because the buying activity gains momentum over the selling activity.
Uniswap price analysis for 1-day
According to the Uniswap price analysis, market volatility follows a trend of an increasing movement, which means Uniswap prices are becoming more vulnerable to volatile changes. The upper limit of the Bollinger’s band is available at $7.3, which acts as the strongest resistance for UNI. Conversely, the lower limit for the Bollinger’s band is available at $4.1, which serves as the strongest support for UNI.
The UNI/USD price appears to be crossing over the curve of the Moving Average, indicating a bullish trend. The price path traces an upwards movement attempting to break the resistance of the market, which will initiate a reversal if it comes into action.
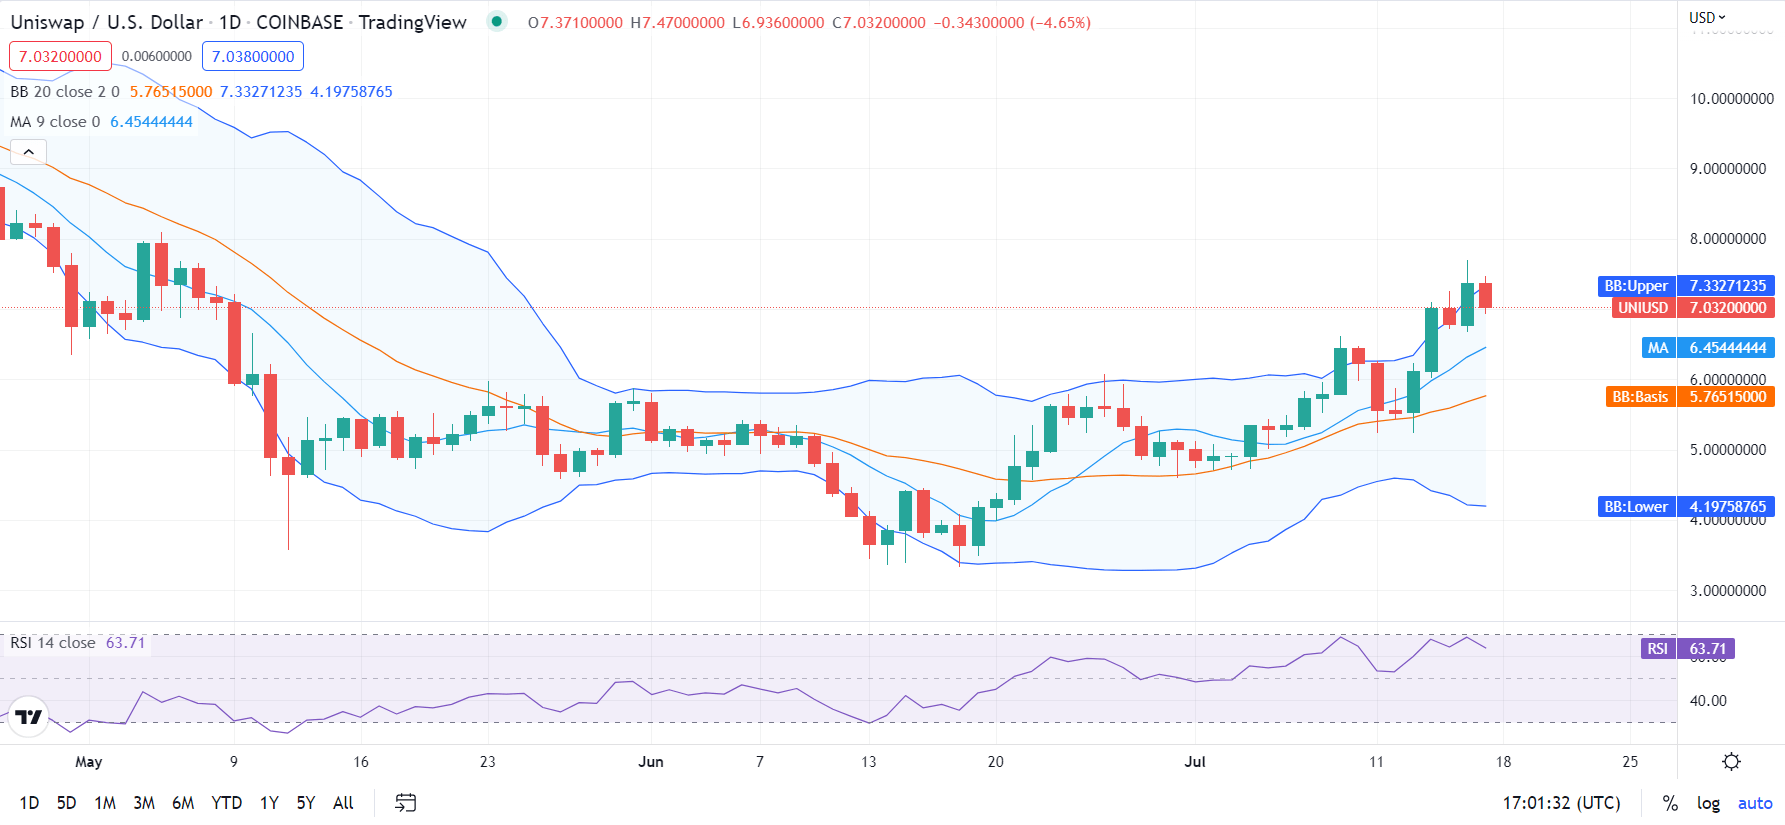
Uniswap price analysis reveals that the Relative Strength Index (RSI) is 63, signifying the cryptocurrency has entered the overvalued domain. Furthermore, the RSI appears to be following a downward path indicating further depreciation and the dedication of the bears, and the price may soon fall under the threshold and further devalue the cryptocurrency. This also signifies that the selling activity is dominant in the market.
Uniswap Price Analysis Conclusion
In conclusion, Uniswap price analysis deduces that the bears are currently controlling the market, but the bulls are trying hard for a comeback. A reverse trend is probable as the RSI score is expected to drop below the threshold. UNI/USD might undergo a significant incline in the coming days. The cryptocurrency has displayed a solid bearish movement in the past few days. Still finally, the figures and observations from the charts show us some hope for the cryptocurrency to bounce back and raise its value.
Disclaimer. The information provided is not trading advice. Cryptopolitan.com holds no liability for any investments made based on the information provided on this page. We strongly recommend independent research and/or consultation with a qualified professional before making any investment decisions.