Chainlink price analysis is favoring the bullish sentiment of the market as bulls have managed to take firm control of LINK prices. Chainlink prices are up with a significant percentage of 5.51, with prices soaring to $6,54. Support for LINK prices has been established at $6.18, while resistance is currently at $6.69. The next key levels to watch for will be $7.21 and $7.73. The market capitalization is also up by 5.44 percent and is currently sitting at $3,053,066,875. The 24-hour trading volume has also increased and is currently at $423,490,348.
Chainlink price analysis in a 1-day price chart: LINK/USD prices surge by 5.51 percent
Chainlink price analysis is up by a total of 7.86 percent in the last 24 hours as bulls have taken firm control of the market. The bullish breakout that was anticipated in the previous Chainlink price analysis has come to fruition as LINK/USD prices surged past the $6.54 level. Key support levels were established at $6.18 which allowed the bulls to take control of the market and push prices higher. LINK/USD prices are currently facing resistance at the $6.69 level, however, if the bulls can maintain their momentum, we could see prices break past this level and target the $7.21 and $7.73 levels.
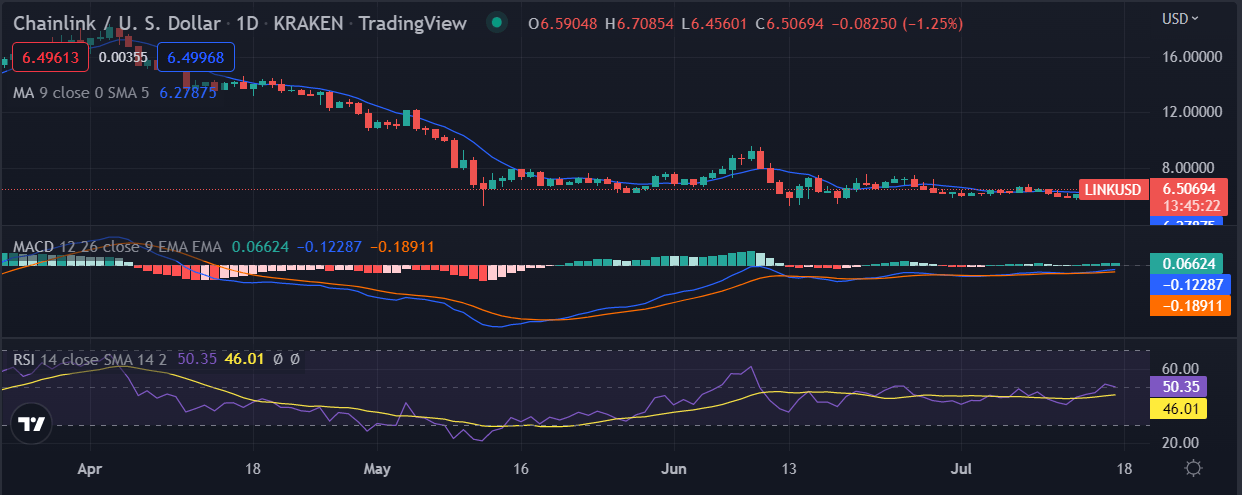
The Relative Strength Index is currently above the 50 level which favors the bulls in the market. The moving average convergence divergence indicator shows that the bullish momentum is still strong in the market as the MACD line is above the signal line. The LINK/USD price appears to be moving over the price of the Moving Average which favors the bulls in the market.
LINK/USD 4-hour price analysis: Latest developments
The 4-hour price chart for Chainlink price analysis shows that the LINK/USD prices have been on a steady uptrend as the market sentiment favors the bulls. The LINK/USD pair has made higher highs and higher lows which indicates that the bulls are in complete control of the market. The bears have tried to enter the market a few times but have been promptly rejected by the bulls.
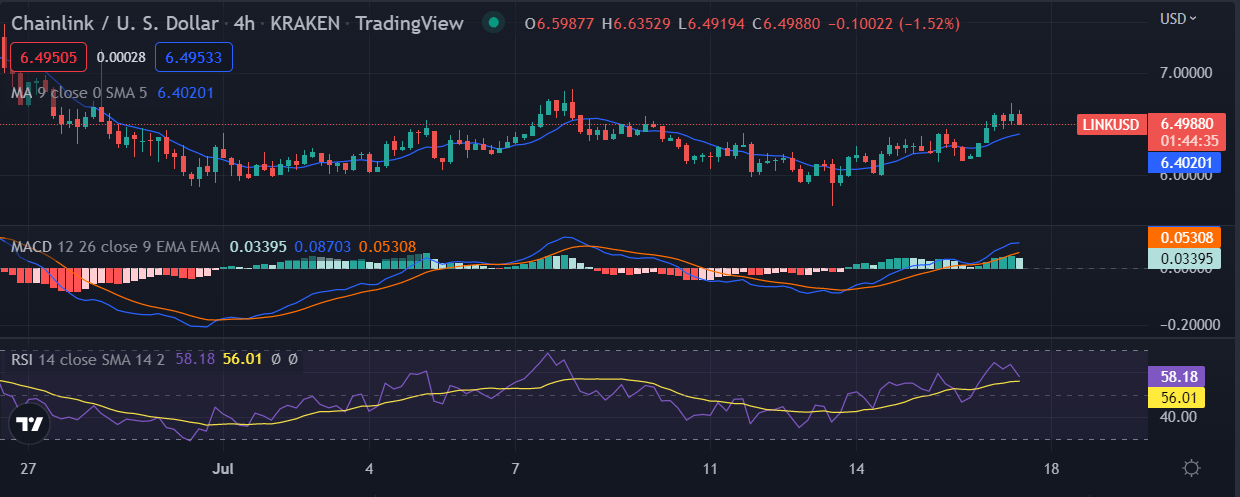
The RSI indicator is moving in the overbought region which indicates that prices might be due for a correction in the near future. However, the bulls might still have some momentum left to push prices higher. The MACD indicator is moving above the signal line which indicates that the bullish momentum is still strong in the market. The Moving average is currently in favor of the bulls as prices are trading over it.
ChainLink Price Analysis Conclusion
Chainlink price analysis reveals the cryptocurrency follows an upward trend with much room for activity on the positive extreme. Moreover, the market’s current condition appears to be following a positive approach, as it shows the potential to move to either bullish extreme.
Disclaimer. The information provided is not trading advice. Cryptopolitan.com holds no liability for any investments made based on the information provided on this page. We strongly recommend independent research and/or consultation with a qualified professional before making any investment decisions.