Avalanche price analysis reveals the previous week observed bullish momentum taking over the market for AVAX/USD. Green candlesticks appeared on the chart, with certain corrections due to the bearish practice as well. Today, the price level increased to $21.4, but the selling pressure has also built up, and currently, the price is decreasing again. However, the losses are in control up till now, but if the selling pressure intensifies, then the trend can turn bearish completely.
AVAX/USD 1-day price chart: bearish upset hinders upwards price movement momentarily
The one-day Avalanche price analysis is dictating an increase in price after the market faced a bearish upset at the start of the day, but bulls came to the rescue soon and continued their upwards lead again. The small green candlestick is indicating an increase in value as the price is $21.4 currently, and the coin shows a 13.89 percent gain in value over the last 24 hours, which is an encouraging sign for the buyers.
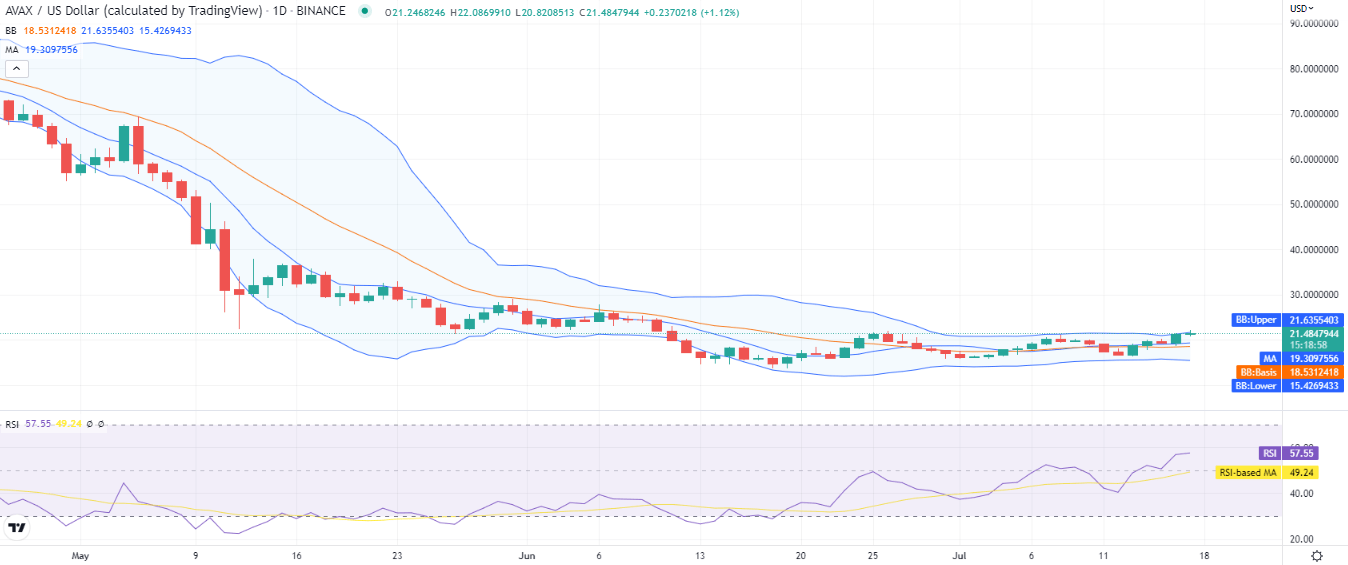
The volatility as observed is mild, which is a promising signal for buyers in the future. The Bollinger bands upper value is present at $21.6, representing the resistance, and the lower value is $15.4 representing the support for AVAX. The moving average (MA) is $19.3, whereas the average Bollinger bands value is $18.5, in the one-day AVAX/USD chart. The Relative Strength Index (RSI) graph shows a little horizontal movement with a value settling at index 57, hinting at the opposition from the bearish side.
Avalanche price analysis: Recent developments and further technical indications
The 4 hours candlestick chart displaying Avalanche price analysis reveals profit for cryptocurrency holders today. The past few hours have been crucial for cryptocurrency, as the selling pressure has returned, and the price levels have fallen to the level of $21.4 currently.
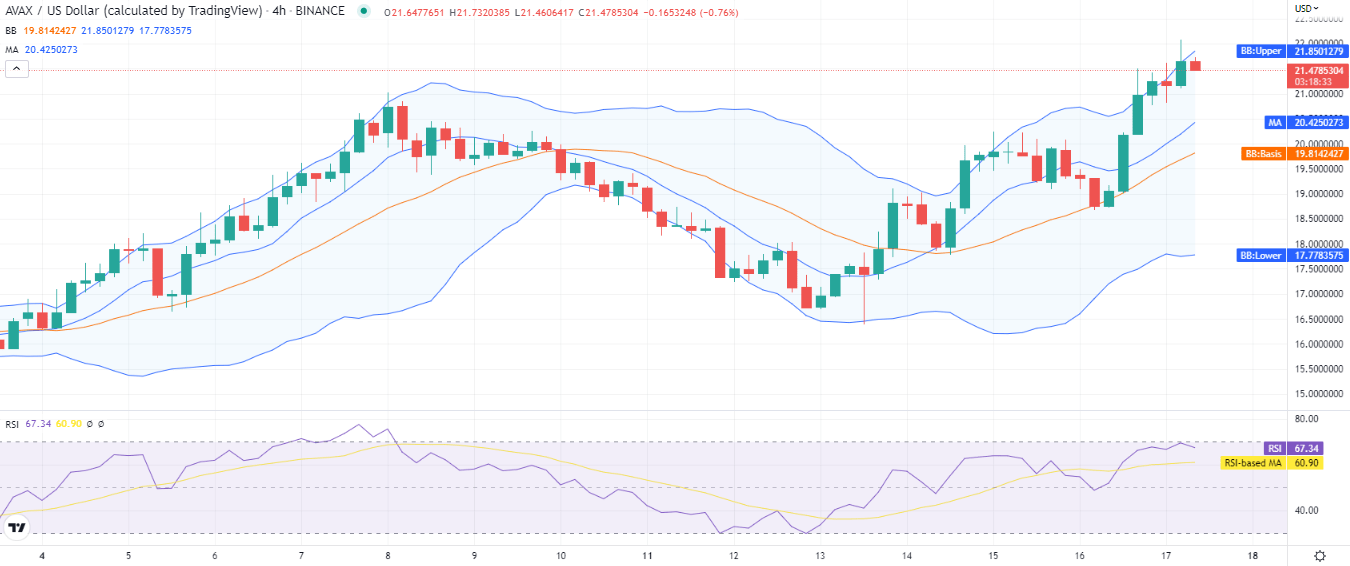
The moving average (MA) has been $20.4 below the current price. The trend line is following an ascending motion, with the volatility still increasing on an hourly basis as the upper Bollinger band has reached $21.8 and the lower band is at $17.7. The RSI has started to fall back after touching the border of the overbought region, and currently, the RSI score is 67, which is still a higher figure, but the downwards curve of the indicator is showing the selling activity in the market.
The technical indicators available for Avalanche price analysis are in support of buyers, which has been the case today. There are 26 indicators collectively, seven indicators stand with sellers, nine as neutral, and the remaining 10 technical indicators support the buyers.
Avalanche price analysis: Conclusion
Avalanche price analysis reveals that today, cryptocurrency price has received a bullish uplift as the price increased to $21.4. On the other hand, if the bullish trend that restarted a few hours back continues in the near future, there is a high probability that the support will take the price even above $22. On the flip side, if selling pressure continues, then the price may revert back to the $20 level.
Disclaimer. The information provided is not trading advice. Cryptopolitan.com holds no liability for any investments made based on the information provided on this page. We strongly recommend independent research and/or consultation with a qualified professional before making any investment decisions.