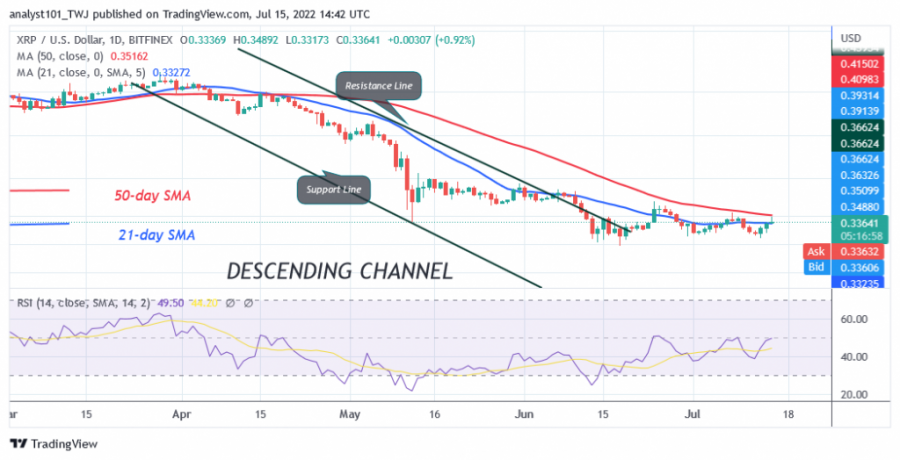
The price of Ripple (XRP) is in a downward correction as the price breaks above the 21-day line SMA. The bulls made another bold move but failed to break the 50-day line SMA. The candle shows a protruding wick.
The long wick indicates selling at higher levels as the bears try to push the altcoin below the moving averages. Selling pressure will intensify. At the time of writing, XRP/USD is trading at $0.33. If XRP falls back below the $0.30 support, the cryptocurrency will continue to fall to the $0.25 low. On the other hand, if the support of $0.30 holds, XRP will rise again and rally above the moving average lines. The bullish momentum will extend to the high of $0.40.
Ripple indicator analysis
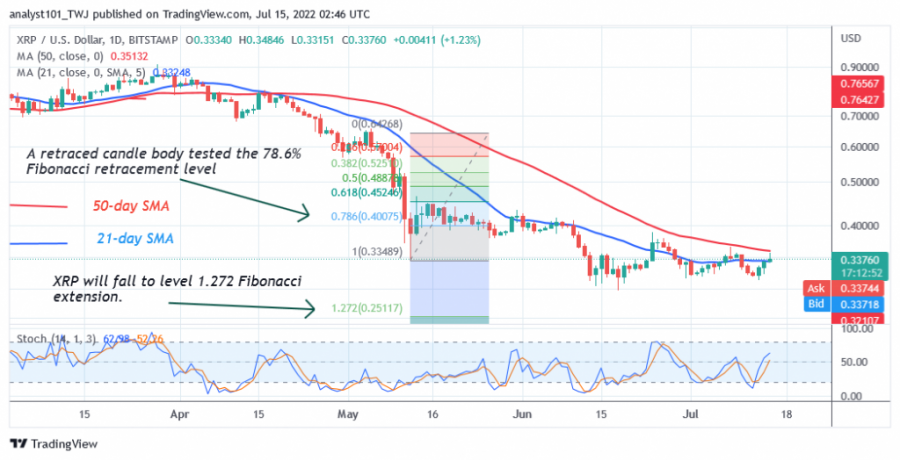
Ripple is at the 50 level of the Relative Strength Index for the 14 period, indicating that there is a balance between supply and demand. The price bar of the cryptocurrency is above the 21-day line SMA and the 50-day line SMA, indicating a possible movement within the trading range. XRP is above the 50% area of the daily stochastic. This suggests that the market has resumed its bullish momentum.

Technical Indicators:
Key resistance levels - $0.80 and $1.00
Key support levels - $0.40 and $0.20
What is the next step for Ripple?
Ripple is vulnerable to a decline as it faces rejection at the 50-day line SMA. However, buyers are trying to push the altcoin above the moving average lines. Meanwhile, on May 12 downtrend, a retraced candle body tested the 78.6% Fibonacci retracement level. The retracement suggests that XRP will fall but reverse at the 1,272 Fibonacci extension level or the $0.25 level.

Disclaimer. This analysis and forecast are the personal opinions of the author and are not a recommendation to buy or sell cryptocurrency and should not be viewed as an endorsement by CoinIdol. Readers should do their own research before investing
 coinidol.com