The Cardano price analysis confirms the recent progression in price, as the bullish momentum is helping to increase the price once again, and the price heightened up to the $0.441 level today. The past few weeks observed constant variations in the price movement, a sharp drop in price was observed from 10 to 12 July 2022, but today the bulls have taken control of the market, and the price is rising for the third day.
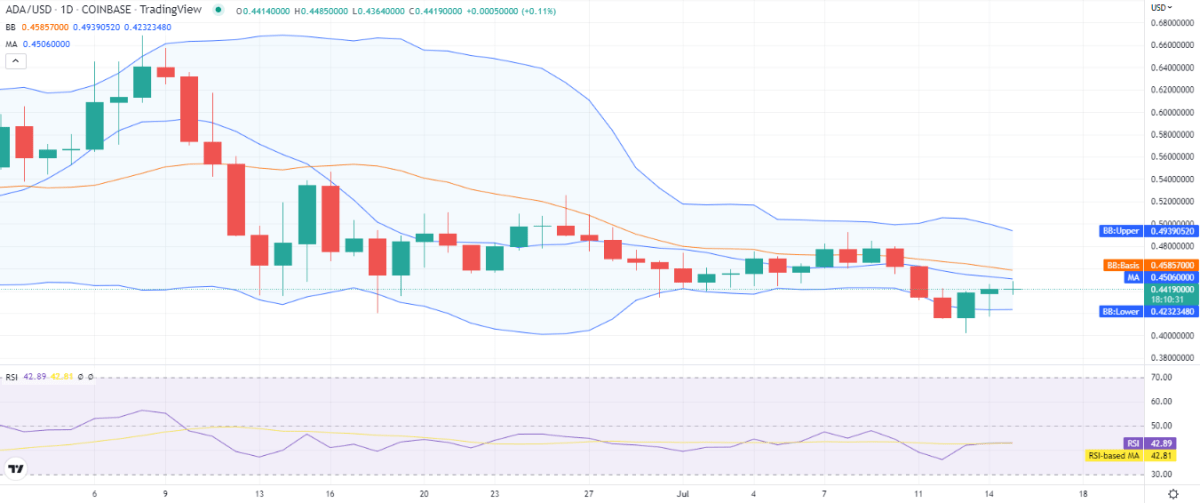
ADA/USD 1-day price chart: ADA rejoins $0.442 after gaining 2.62 percent
The price is going up as the bullish momentum has constantly been moving ahead over the past few days. The bullish trend has taken the price above $0.441 as the bulls are trying to reverse the downtrend, and this equals a gain in the value of 2.62 percent for the last 24 hours. The SMA 20 curve is still trading below the SMA 50, which is again indicating the bearish pressure. The moving average indicator (MA) is keeping its value at $0.450 as the overall progress has been slow. Bulls showed good momentum on 10 July 2022, but their progress has been hindered by the wild downswings observed on an hourly basis since yesterday.
 ADA/USD 1-day price chart. Source: TradingView
The volatility has been comparatively mild, which means further uptrends may follow in the future. Moving on, the Bollinger bands’ values are as such that the upper band is at $0.493, representing resistance, whereas the lower band is at $0.423, representing support. The Relative Strength Index (RSI) score is now balancing itself at index 42 after the rise in price, but as the price elevation is quite slow, the RSI is also trading at a horizontal line.
Cardano price analysis: Recent developments and further technical indications
The four-hour Cardano price analysis confirms the increase in price as the bulls made a comeback in the past few hours. They elevated the price significantly yesterday after bears plunged it down. Bulls were successful in recovering from the loss, but they got exhausted afterward, followed by another plunge, which they recovered again. This is the sequence visible on the hourly charts since 13 July. The cryptocurrency recovered again as the price has been uplifted up to $0.442 now. The moving average (MA) indicator has traveled above the Bollinger bands average line, and its value is settled on the $0.435 mark for now.
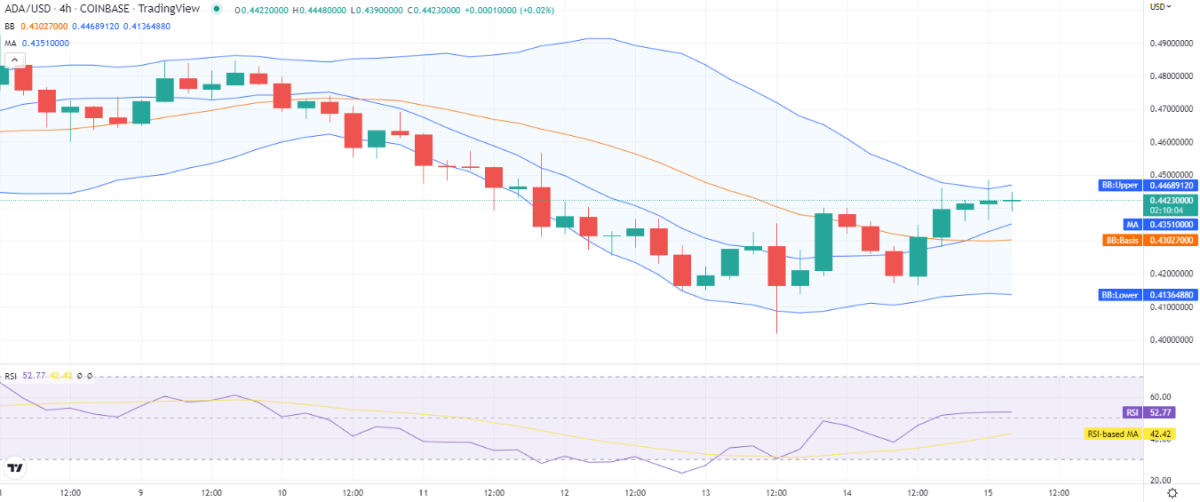 ADA/USD 4-hours price chart. Source: TradingView
Although a crossover between SMA 20 and SMA 50 occurred previously, the current scenario shows a slow down in bullish progress. The Bollinger bands Indicator’s upper value is sitting at $0.446 while the lower one is at $0.413. The bullish momentum has helped the RSI maintain its slight upwards curve as its score has moved up to index 42.
Cardano price analysis: Conclusion
The given one day and the four hours Cardano price analysis is dictating that a rise in price has occurred today as well. The price can be seen standing at the $0.442 level after the bullish continuation. If the cryptocurrency succeeds in maintaining its support, a further uptrend is to follow in the coming week as well.
Disclaimer. The information provided is not trading advice. Cryptopolitan.com holds no liability for any investments made based on the information provided on this page. We strongly recommend independent research and/or consultation with a qualified professional before making any investment decisions.