Chainlink price analysis shows that the LINK/USD pair is currently in a bullish trend. The pair has formed higher lows and higher highs on the 4-hour chart. The price currently trades above the 21-day moving average and the 50-day moving average. The RSI is above 50 levels, which indicates that the bulls are in control. The MACD is also in the positive territory, further confirming the market’s bullishness. Currently, Chainlink is facing resistance at $7.6; if it can sustain above this level, it can move towards $10.
On the downside, support is at $5.4, and if the price breaks below this level, it can drop to $3.8. The bias is bullish, and the LINK/USD pair can move towards $10 levels in the near term.
On the upside, the LINK/USD pair can move towards the $10 level. Chainlink (LINK) is currently on a bullish run as the price has surged above the $7 resistance level. The next resistance levels to watch out for are $8 and $9. The bias is bullish in the near term, with a chance of testing highs near $10.
Chainlink price action on a 1-day price chart: Slight bullish trends
On the 1-day chart, Chainlink price analysis shows that the bullish trend appears to be over as the price has formed a bearish candlestick. The immediate support for LINK/USD is at $5.4, and if the price breaks below this level, it can drop to $3.8.
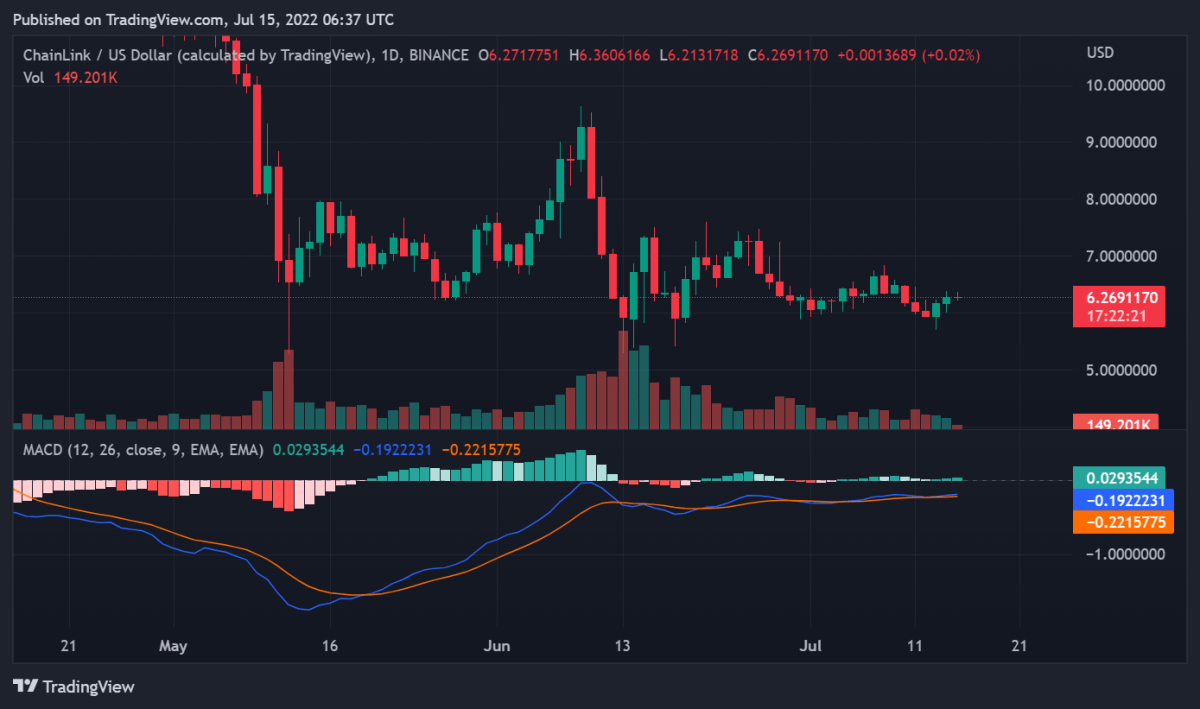 LINK/USD 1-day price chart, Source: TradingView
Moving averages are indicators that measure the price of a stock over time. On the 1-day chart, Chainlink’s 50-day SMA (blue line) has crossed below its 200-day SMA (red line), which marks a bearish crossover. The moving averages have continued to fall, confirming this market downturn and indicating that it has entered a downtrend. As the MACD signal line has crossed below the histogram, Chainlink price analysis is now in bearish territory. This implies that the market momentum is presently bearish, and prices may continue to fall soon.
LINK/USD 4-hour price analysis: Recent price developments
The 4-hour chart for Chainlink price analysis shows that the LINK/USD pair has formed a bearish candlestick pattern. The price has broken below the $7 support level and is now trading at $6.22. The immediate resistance for LINK/USD is at $7.6, and if the price breaks above this level, it can move towards $10.
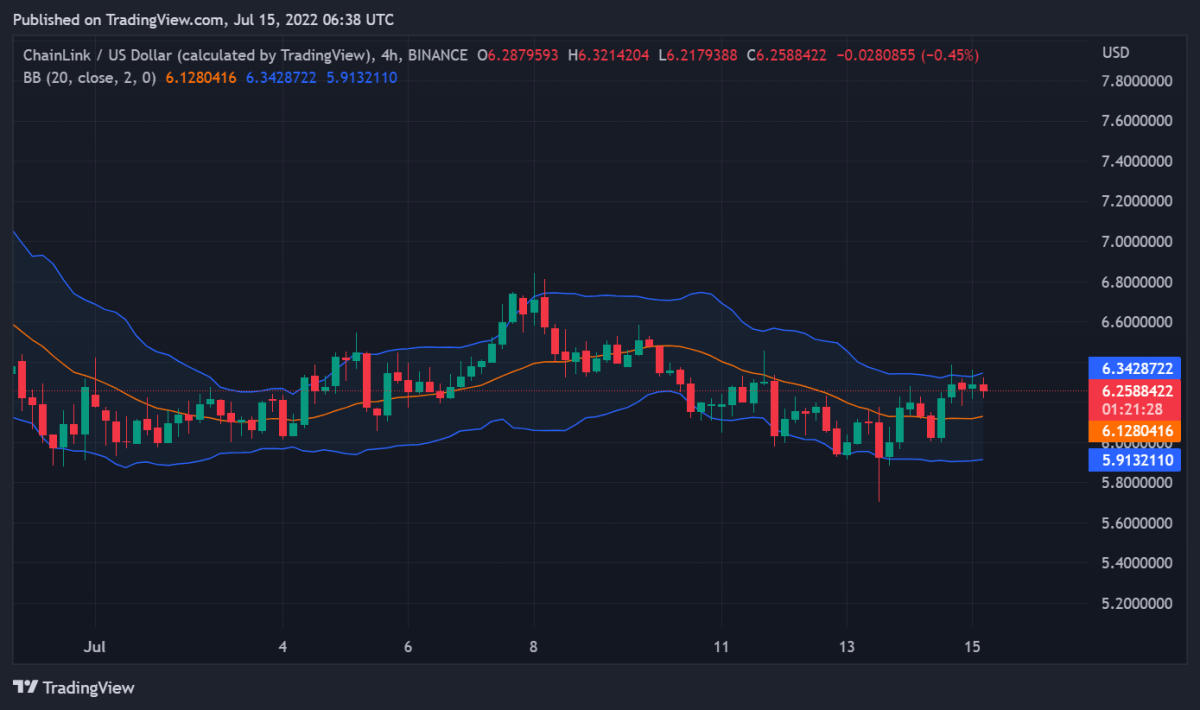 LINK/USD 4-hour price chart, Source: TradingView
The MACD indicator is in the bearish territory beneath the signal line, suggesting that the market’s momentum is also bearish. The 50-day and 200-day moving averages are heading south, indicating a downtrend in progress.
Chainlink price analysis conclusion
If LINK/USD can hold the $5.4 support level, it may resume its uptrend towards the $10 resistance level. If not, a further decline towards $3.8 is possible. While Chainlink’s short-term prospects appear bearish, the long-term picture still looks promising as the LINK/USD pair is trading well above its 200-day moving average.
Disclaimer. The information provided is not trading advice. Cryptopolitan.com holds no liability for any investments made based on the information provided on this page. We strongly recommend independent research and/or consultation with a qualified professional before making any investment decisions.