- Bitcoin cash price recovered recently from $105, but struggled to break $120 against the US Dollar.
- There is a crucial bearish trend line formed with resistance at $116 on the 4-hours chart of the BCH/USD pair (data feed from Kraken).
- The pair is likely to make the next move either above the $116-120 resistance or decline below $105.
Bitcoin cash price is struggling to gain momentum above $115-120 against the US Dollar. BCH is setting up for the next break either above $120 or below $105 in the near term.
Bitcoin Cash Price Analysis
There was a fresh decline recently in bitcoin, ripple, Ethereum, and bitcoin cash against the US Dollar. The BCH/USD pair traded towards the $105 level and later started an upside correction. The price moved above the $110 and $112 resistance levels. There was a break above the 23.6% Fib retracement level of the last decline from the $134 high to $105 swing low. Finally, there was a break above the $115 level, but the price struggled near the $120 resistance level.
More importantly, the price failed to break the 55 simple moving average (4-hours) near $119. Besides, there is a crucial bearish trend line formed with resistance at $116 on the 4-hours chart of the BCH/USD pair. The pair also failed to break the 50% Fib retracement level of the last decline from the $134 high to $105 swing low. As a result, there was a fresh decline below $116 and $115. The price is currently trading below $115 and it remains at a risk of more losses. If the price continues to move down, the price may revisit the $105 support. Any further declines could lead to a sharp decline below $102 or $100.
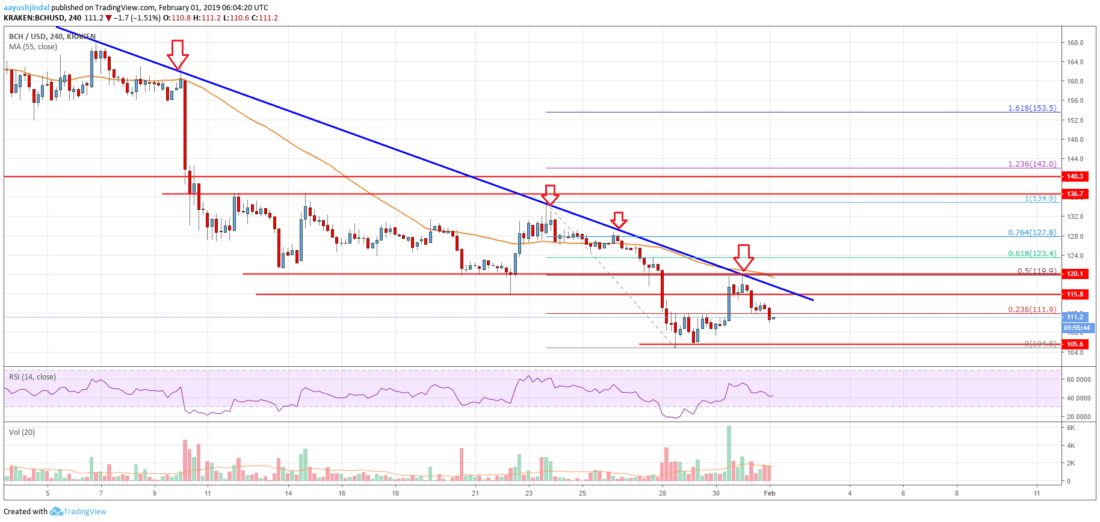
Looking at the chart, bitcoin cash price likely to make the next move either above the $116-120 resistance or towards $100. A proper break above the $120 resistance may kick start a decent upward move towards $135.
Technical indicators
4-hours MACD – The MACD for BCH/USD is placed in the bearish zone.
4-hours RSI (Relative Strength Index) – The RSI for BCH/USD is now well below the 50 level.
Key Support Level – $105
Key Resistance Level – $120