Chainlink price analysis shows that the market is in a bearish trend as prices have slipped below the $6.03 mark. The current support for prices lies at the $5.80 level and a move below this could see prices head towards the $5.50 level while the Resistance for prices lies at the $6.24level and a break above this could see prices head towards the $6.50 level.
The LINK/USD pair has decreased by 1.48 percent over the past 24 hours of trading, bringing the price for the cryptocurrency down to around $5.80 at the time of writing. Chainlink is currently ranked in 8th position as it holds a $2,816,875,080 market cap value and 24-hour trading volume of $391,585,087.
Chainlink price action on a 1-day price chart: Bearish spell sinks LINK prices to lows of $6.03
The 1-day chart for Chainlink price analysis shows the bearish trend appears to be intact as prices have slipped below the key $6.03 level. The coin had earlier surged to as high as $6.88 but faced rejection at this level and selling pressure soon mounted leading to the current price levels. The Relative Strength Index(RSI) indicator on the 1-day chart is currently in oversold conditions with a reading of 28.60 which indicates that prices may be due for a corrective rally higher as the RSI returns back into oversold territory.
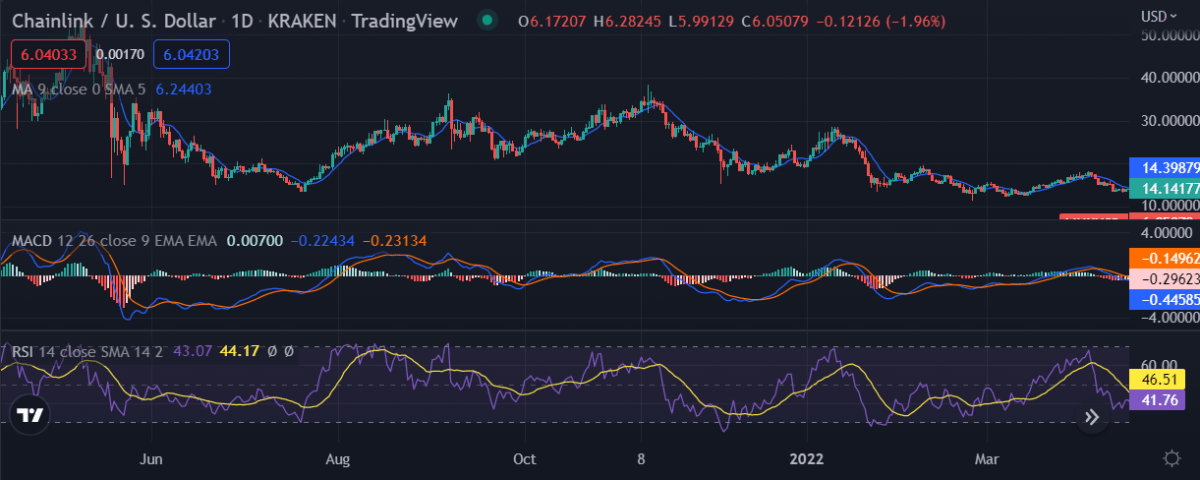 LINK/USD 1-day price chart, Source: TradingView
The moving averages on the 1-day chart for Chainlink price analysis have been bearish s as the 50-day SMA (blue line) crossed below the 200-day SMA (red line). This bearish crossover indicated that the market had entered a downtrend and this has been further confirmed by the moving averages as they have continued to head south. The MACD indicator for Chainlink price analysis is currently in the bearish territory as the signal line has crossed below the histogram. This indicates that the market momentum is currently bearish and prices could continue to head lower in the short term.
LINK/USD 4-hour price analysis: Further price decline likely
The 4-hour chart for Chainlink price analysis shows that the market is in descending channel formation as the market consolidates at the $5.80 level. The technical indicators are currently bearish as the Relative Strength Index is below the 50-level, which indicates that the market is currently in a bearish phase.
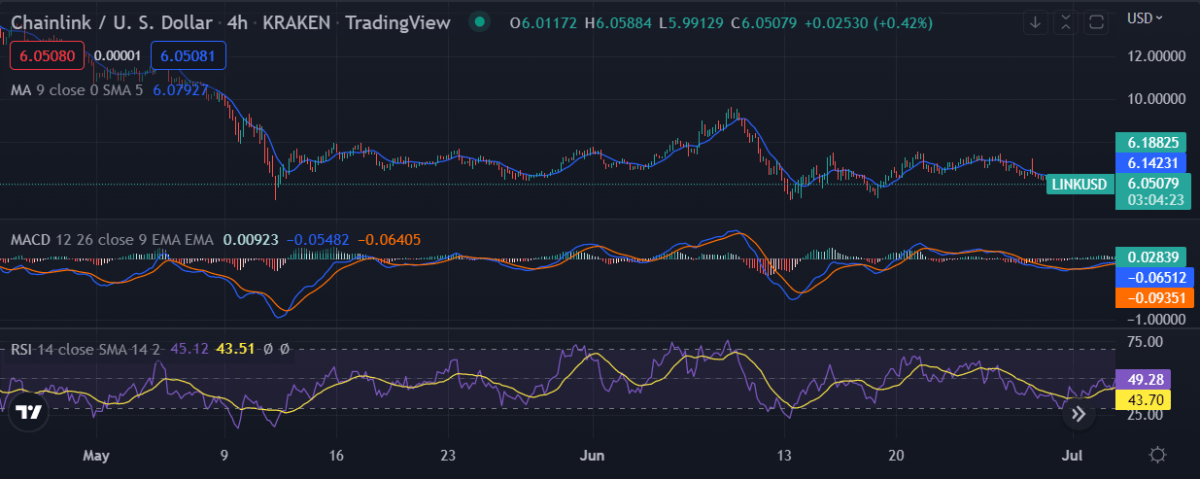 LINK/USD 4-hour price chart, Source: TradingView
The MACD indicator is below the signal line and is currently in the bearish territory which indicates that the market momentum is bearish as well. The 50-day SMA and the 200-day SMA are both heading south which indicates that the market is in a downtrend.
Chainlink price analysis conclusion
Chainlink price analysis shows that the coin price covering range downwards and is trading at the $6.03 mark. Chances are there for further decrease as the price has decreased during the last hours. The technical indicators are currently bearish, and a breakout or a rebound is awaited before making any investment decisions.
Disclaimer. The information provided is not trading advice. Cryptopolitan.com holds no liability for any investments made based on the information provided on this page. We strongly recommend independent research and/or consultation with a qualified professional before making any investment decisions.