Cardano [ADA] showed no impressive price movements during the first month of this year. The eleventh-largest cryptocurrency on CoinMarketCap, ADA, burgeoned to a market cap of $1.40 billion on January 10, the highest recorded for the digital coin this month. During the last 24 hours, ADA witnessed a steady increase in its valuation.
At the time of writing, ADA noted a market cap of $1.02 billion priced at $0.039. The total volume of the crypto-coin traded was $28.08 million, with an optimistic 2.31% change in the otherwise stagnant market.
1-hour
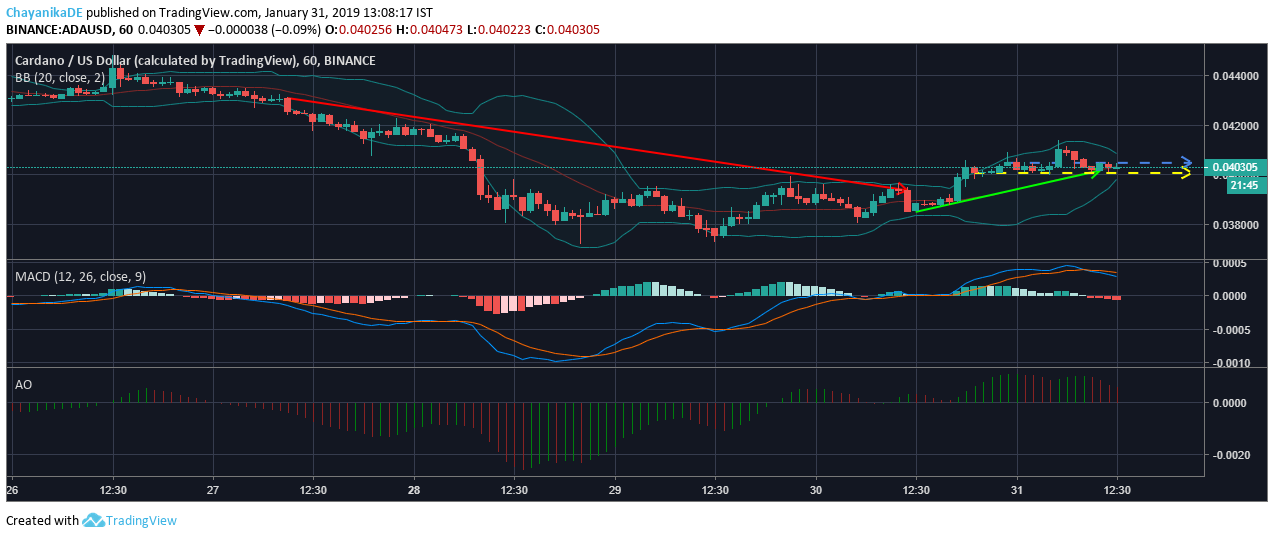
Source: Trading View
In the one-hour stint, ADA a moderate uptrend of $0.040 from $0.038 and a downtrend of $0.043 to $0.039 have been registered. The price momentum between $0.0405 and $0.038 was noted wherein the immediate resistance and the support were marked respectively.
The converging Bollinger Band points to a low price volatility for ADA.
The MACD line treading below the Signal line points towards a bearish trend for the coin.
Moreover, the Awesome Oscillator draws a bear picture with the lines in red.
1-day
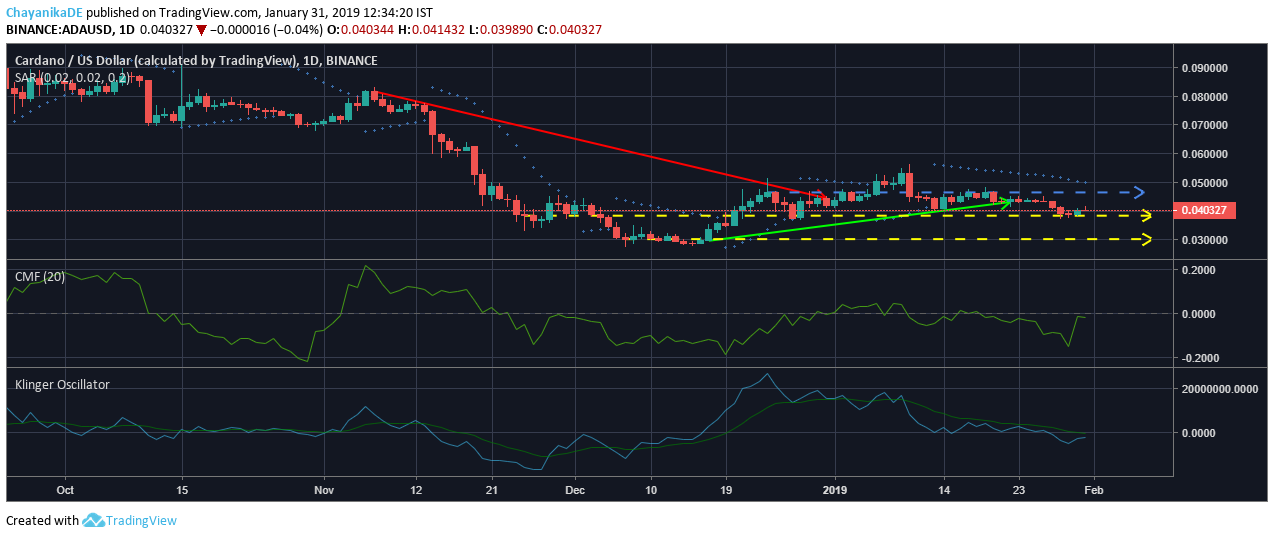
Source: Trading View
ADA exhibited a mediocre uptrend to $0.043 from $0.039 as opposed to the massive downtrend to $0.044 from $0.082. The resistance for this time period was marked at $0.046 and two supports were noted at $0.038 and $0.030.
Parabolic SAR indicator for the time period of one-day points towards a bear market trend for ADA with the dotted lines aligned above the candles.
The Chaikin Money Flow graph treads below the zero-line, also indicating that the coin’s price movement towards a bear zone.
Klinger Oscillator suggests a bear trend for ADA.
Conclusion:
Indicators such as MACD, Awesome Oscillator, Parabolic SAR, CMF and Klinger Oscillator, all demonstrate ADA’s price momentum in the bear zone. Bollinger Bands, however, exhibited low price volatility and a stable pace for the coin. Also, the CMF graph, which is very close to the zero-line, might potentially move upward to the bull space.