Litecoin price is bearish today, as the coin has sunk below $50 for the first time this year. For a period of time, the LTC/USD pair was following an ascending parallel channel, but it failed to break through and instead dropped severely. The pair is now trading at $48.29 and has resistance at $51.03, but a breakthrough above this level is required for further gains. Litecoin's support resides at $47.76, and if this barrier is broken, the price of Litecoin may fall to as low as $45.38. The LTC/USD pair is now valued at $48.29 and has dropped by more than 2% in the previous 24 hours, as the cryptocurrency market continues to bleed red. Litecoin's market capitalization stands at $3.31 billion, with a trading volume of $384,609,689 per day.
LTC/USD 1-Day Price Chart
On the 1-day chart for the LTC/USD pair, we can see that Litecoin has been following an ascending parallel channel throughout the weekend and even broke out of it briefly. The bulls, on the other hand, were unable to maintain this momentum and Litecoin tumbled dramatically today. The price of Litecoin is presently trading near the middle line of the channel, and a break below this level may result in Litecoin's fall to $45.38. 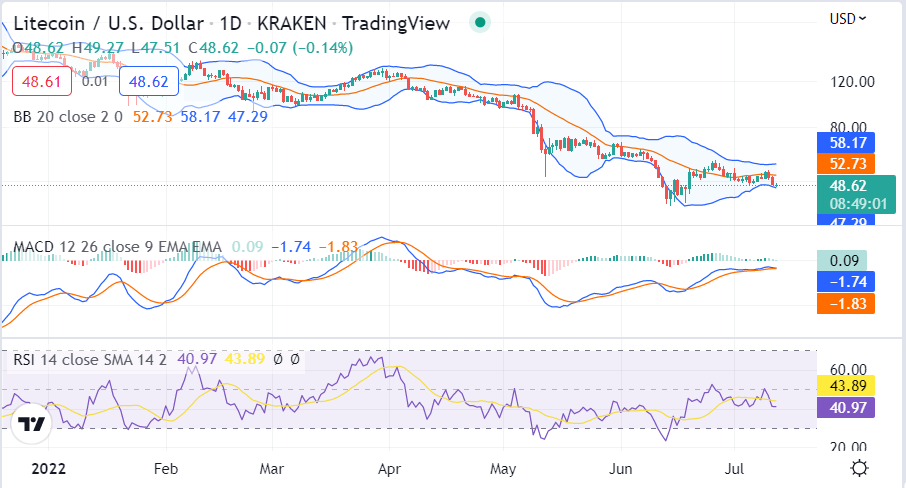 Source: TradingView The upper Bollinger bands have expanded, showing a greater degree of market volatility, while the lower Bollinger bands have shrunken, suggesting less volatility. The Relative Strength Index is presently at 42.80 and is on track to enter the oversold region, which may provide Litecoin some support. The MACD indicator is signaling potential bearishness, with the signal line having crossed below the MACD line, and a further drop might see the MACD line cross below.
LTC/USD 4-Hour Price Chart
On the 4-hour chart for Litecoin technical analysis, we can see that Litecoin has formed a descending channel and is currently trading at the bottom of the channel. The market has endured significant selling pressure in the last few hours, yet bears are now on the upswing. 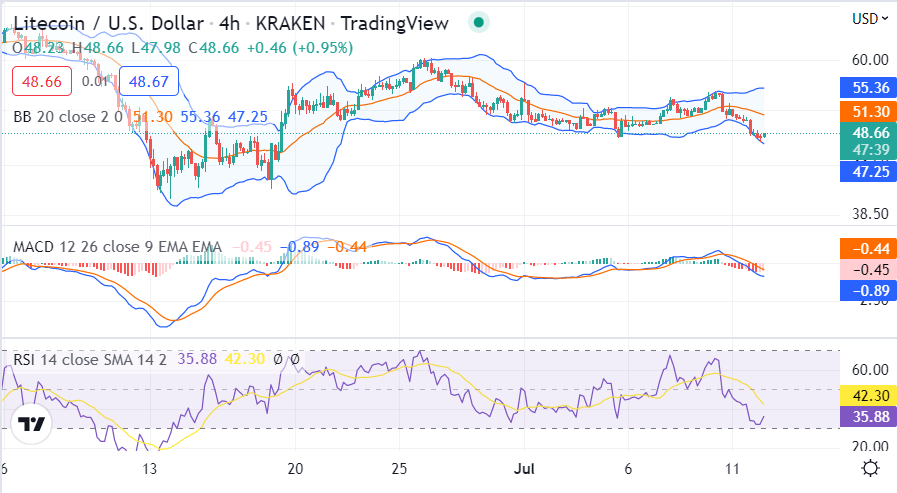 Source: TradingView The Relative Strength Index is in oversold territory at 32.89, indicating that the market is deeply depressed. As the MACD indicator has dropped below the signal line, it has become bearish, and a further drop may result in the MACD line crossing below the signal line. The upper and lower Bollinger bands have shrunken, suggesting decreased volatility in the market
Conclusion
From the above 1-day and 4-hour price chart, it appears that the bears have taken control of the market once again, as Litecoin has fallen below $50. The bears have been able to drag Litecoin below the parallel channel's middle line, and a further decline could drive it toward $45. The bulls will need to sustain enough momentum in order for Litecoin to break out above the $51.03 mark and continue its climb.