The cryptocurrency bloodbath over the weekend seems to have staunched somewhat, with most including Litecoin [LTC] registering some form of stability, if not growth. Litecoin [LTC] has, in fact, registered a positive growth rate of 1.49% over the past 24 hours.
At the time of press, LTC was valued at $31.36 and is placed seventh in the list of the world’s largest cryptocurrencies with a market cap of $1.889 billion. It had a 24-hour trading volume of $682 million, with DOBI exchange contributing a significant 6.96% to the same, via the trading pair LTC/BTC.
1-hour
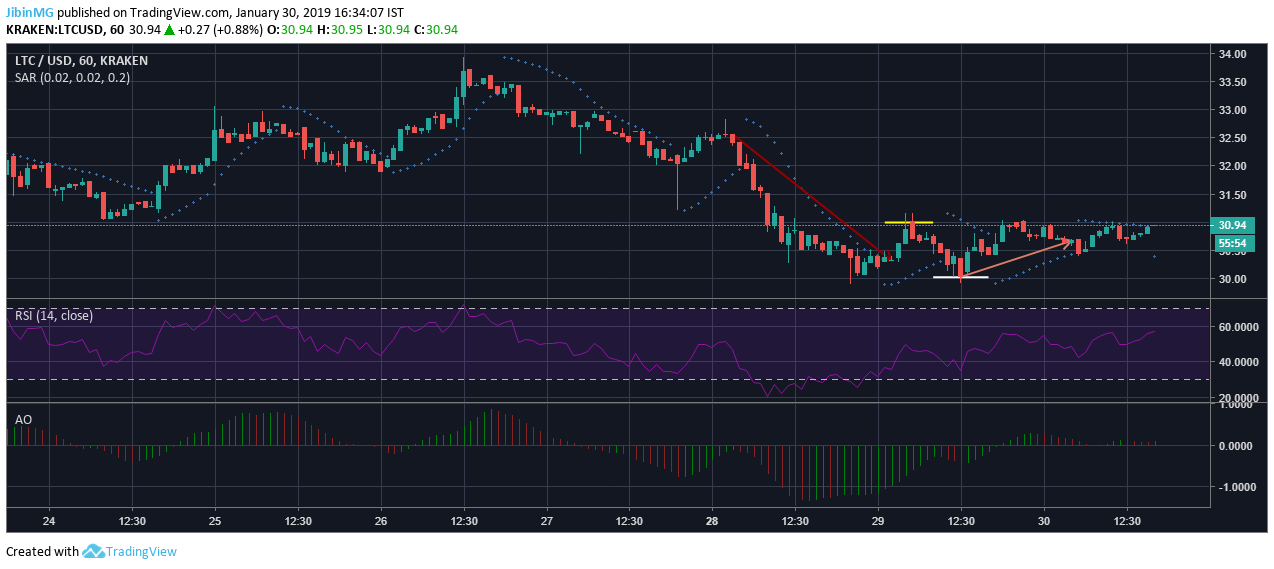
Source: TradingView
In the one-hour graph, it can be seen that LTC is gradually bringing bearish momentum to heel. Much of the downtrend that extended from $32.56 to $30.32 remains. However, the uptrend from $30.03 to $30.67 indicates some bullish activity. Both the resistance and support points hold strong at $30.99 and $30.02 respectively.
The Parabolic SAR indicates that the bearish trend to the market has been overturned by some bullish activity, at least in the short-term, suggesting a possible bullish run.
The Relative Strength Index has the reading line below the point of sixty and yet, above forty. This suggests that the LTC market is neither oversold or overbought and both buying and selling pressures have evened themselves out.
The Awesome Oscillator depicts the market trending above zero, and in the green. This suggests that the LTC market is turning bullish.
1-day
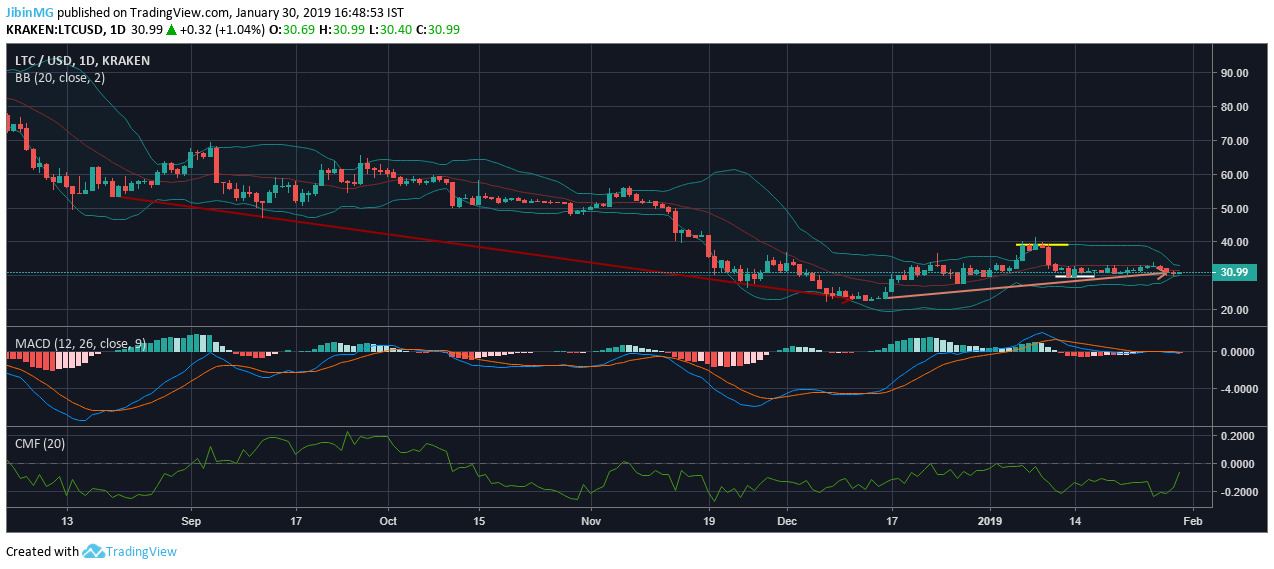
Source: TradingView
The longer-term, one-day chart for the LTC market indicates that it is yet to overhaul the massive downtrend that extended from $53.36 to $23.17. This is despite a brief uptrend that existed between $23.38 to $30.88. The resistance point holds firm at $39.17 while on the other hand, the support point at $29.78 may or may not hold out in the next few weeks.
The Bollinger Bands for the one-day chart are contracting over the past few trading cycles, suggesting that volatility is falling and that any price movement will be merely superficial or sideways.
The MACD line in blue is creeping just under the green signal line. This and the red histogram suggest that the LTC market in the long term will have a bearish outlook.
The Chaikin Money Flow has the reading line well below zero. This suggests that the LTC market is bearish and that there is money flowing out of the market, indicating the possible sale of LTCs.
Conclusion
The projections put forth by both the short-term and the one-day charts offer differing conclusions. While the one-hour chart supported by indicators such as Awesome Oscillator and Parabolic SAR suggests a bullish run soon, the longer term, one-day chart, supported by the CMF and MACD indicators suggests that the overall trend remains bearish, despite some bullish activity against it.