Avalanche price suggests that since it hit highs of $23.38 in May, the AVAX/USD pair has been steadily declining. The market has found support at $18.21, but the bulls have not been able to drive the price higher. The AVAX/USD pair is presently valued at $18.36, having resistance at $19.65. The AVAX/USD pair is presently in a bearish trend and is anticipated to fall further in the near term. In the last 24 hours, the price has dropped by 1.96 percent and the market capitalization for the coin is $5,241,273,746 with $334 million in trading volume over that time frame.
AVAX/USD 1-Day Technical Analysis
On a 24-hour Avalanche technical analysis, the market has been facing rejection at $19.65 for a short time before consolidating. The prices have remained in the $18.21 to $19.65 range, and it looks like the market will start going up when it breaks out of this range. To enter into new long positions, investors should look for a breakthrough above the $19.65 resistance or a breakdown below the $18.21 support level. 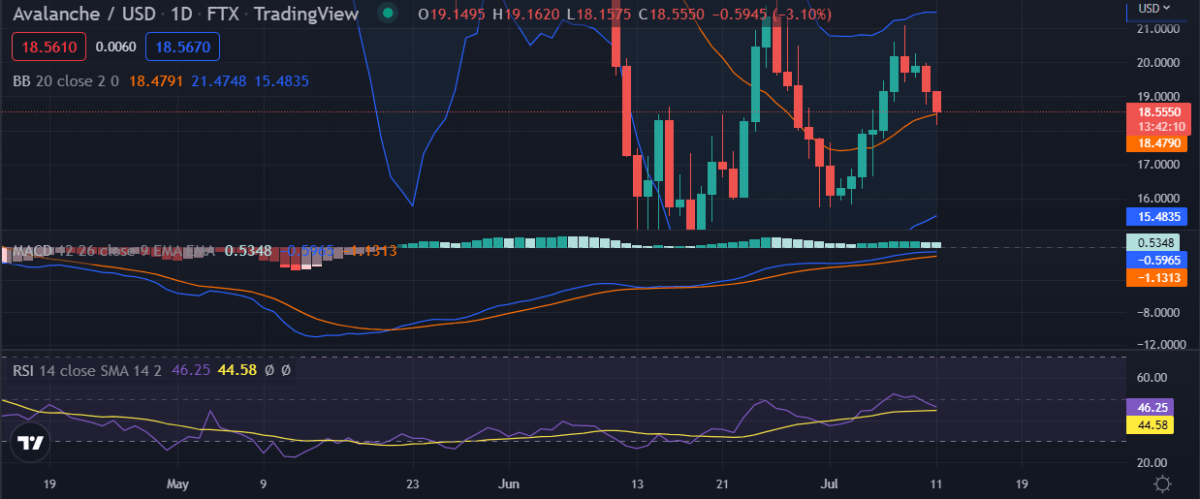 Source: TradingView The AVAX/USD pair's RSI is currently at 58.37, and it is gradually rising. This indicates that the market is gaining momentum and will continue to rise in the near term. The MACD for the pair is in a bearish position, implying that the market is declining, while the Bollinger Bands for the pair are now contracted, suggesting that the market is in a consolidation period.
AVAX/USD 4-Hour Technical Analysis
The market is in a clear bearish trend, according to the 4-hour Avalanche price chart. Over the previous several days, prices have been falling at an accelerating rate, suggesting that there will be no stopping until now. The decreasing volume is another sign that the market is slowing and that it will continue to decrease in the near future. The $18 support level for the AVAX/USD pair appears to be a major barrier before any form of support can be found, with the market seeming poised to approach this level before finding any sort of support. 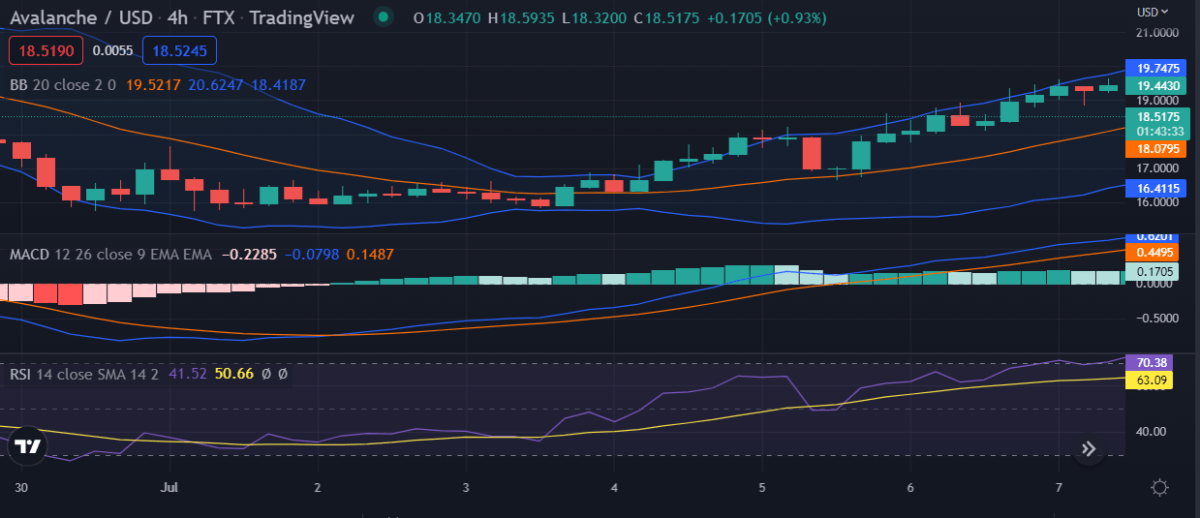 Source: TradingView The Bollinger bands on the AVAX/USD 4-hour chart are right now in a very tight range, which is a sign that the market is in a bearish position. The pair's RSI is presently at 37.91 and is heading towards the oversold area. The MACD indicator for the pair has crossed below the signal line, which is a sign that the market is in a bearish trend.
Conclusion
Overall, the AVAX/USD pair is in a clear downtrend, and it is anticipated to continue heading lower in the near term. The $18 mark is a crucial support level to keep an eye on, and if it holds, we may see a resurgence in prices. However, if the $18 level is broken, the AVAX/USD pair may move to the $17 level. The market is presently in a negative technical position, with both charts displaying bearish technical indicators that predict further depreciation in the near future.