MATIC cryptocurrency has become interesting for investors again. Of course, not as interesting as in the period from January to May 2021. However, in June 2022, trading volumes finally increased several times. Even during the weekly candle of 9 May, when sellers tried to break the $0.58 mark, trading volumes were lower than during the first month of summer. The stop of the uncorrected fall from January 2022 is already a good sign and it is time to determine the critical points above which the falling trend will be broken. 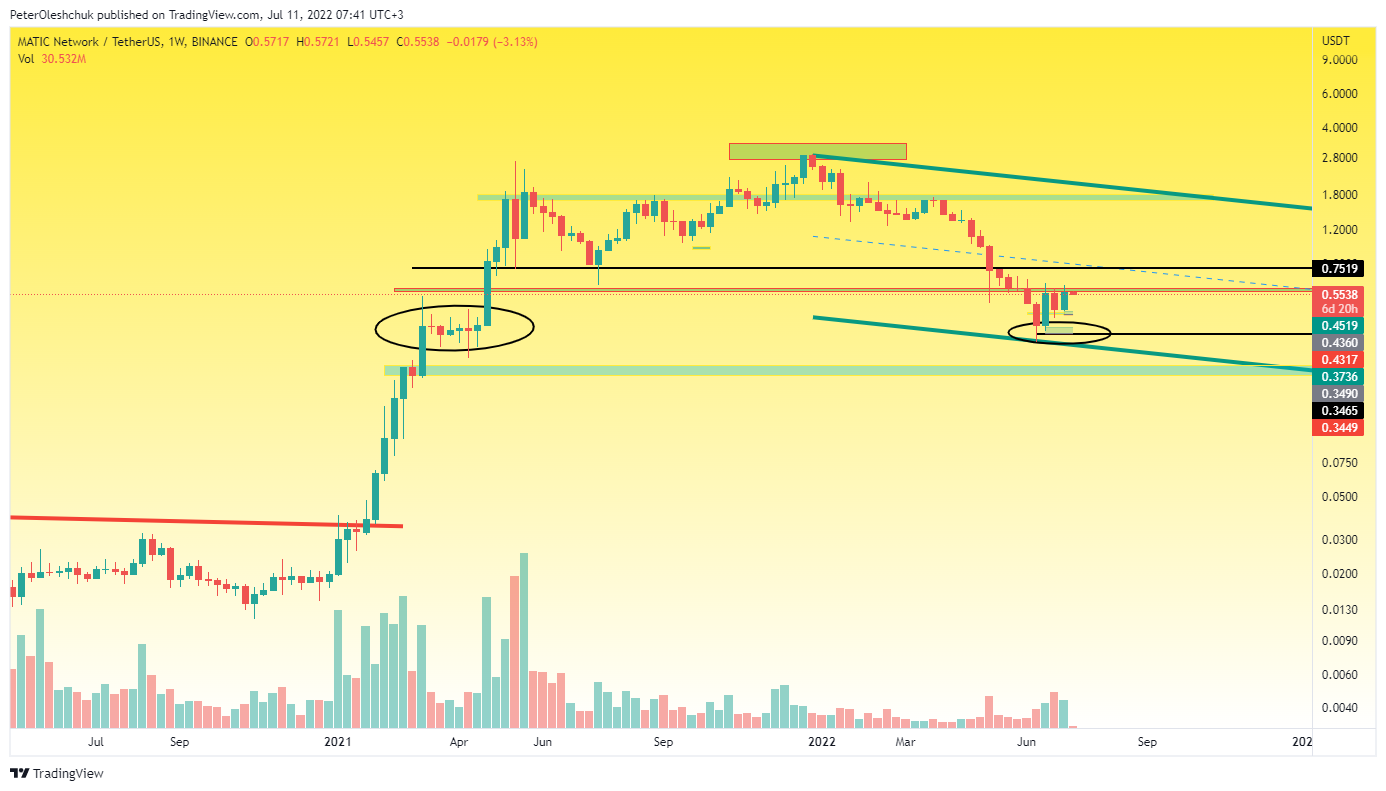 Source: https://www.tradingview.com/x/cWxbn9O5/ The weekly chart shows that sellers have spent a lot of effort to take control of the $0.58 mark. However, these efforts did not yield the desired result. After breaking the $0.58 mark, the MATIC price did not continue its aggressive decline. Instead, buyers began placing limit orders, which caused the MATIC price to slow down. The $0.38 range stopped the decline and allowed buyers to form a rebound. For three weeks now, buyers have had a local initiative on the market. Though, an unsuccessful attempt to take control of the $0.58 mark may turn into a new fall wave even from the local low update. For the MATIC price to continue to rebound upwards, buyers should keep the local mark of $0.5. It was this mark that stopped the strong impulse of the fall from 9 May, and in the case of buyers' strength, it is quite suitable for the role of local support. The loss of the $0.5 mark by buyers will open up the prospect of a continuation of the fall to $0.38 for sellers.
MATIC Technical Analysis On The Daily Timeframe
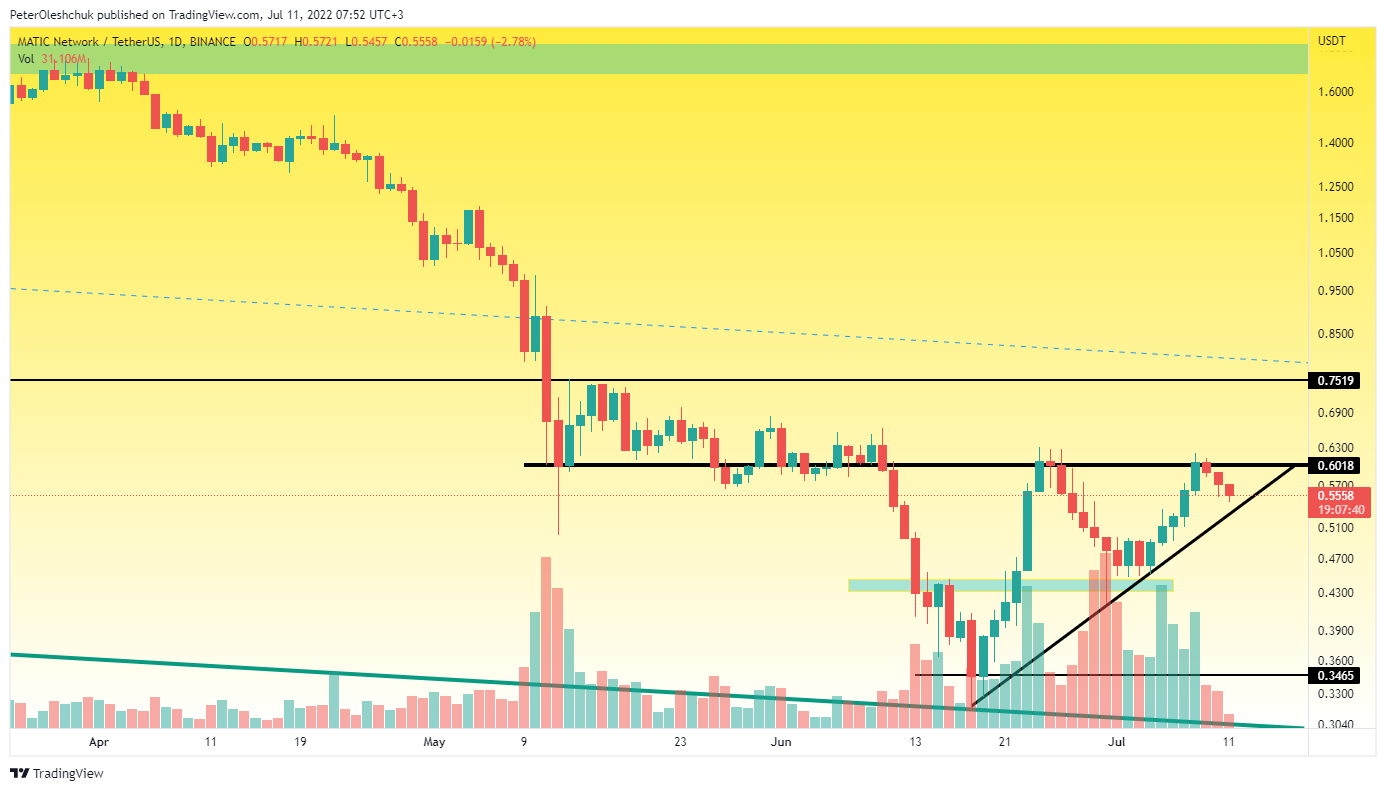 Source: https://www.tradingview.com/x/THL2TfbX/ Analyzing the price movement of MATIC on the daily timeframe, you can see the completion of the formation of a consolidation triangle with a flat top. According to statistics, such triangles shoot upwards more often. Another matter is how strong and whether the slight growth impulse will be a signal for sellers to a new fall wave. But, please pay attention to the trading volumes in the period from 25 June to 8 July. During this period there was an initial fall wave and then a growth wave. Both the first and second waves were supported by high volumes. This is a sign of a serious struggle. The next three days of trading after 8 July take place at low volumes. If the trend line of the triangle keeps such weak pressure from sellers, it will be a signal of weakness and continued growth of MATIC to the mark of $0.75 without deep correction.
The MATICBTC Price Has The Prospect Of Continued Growth
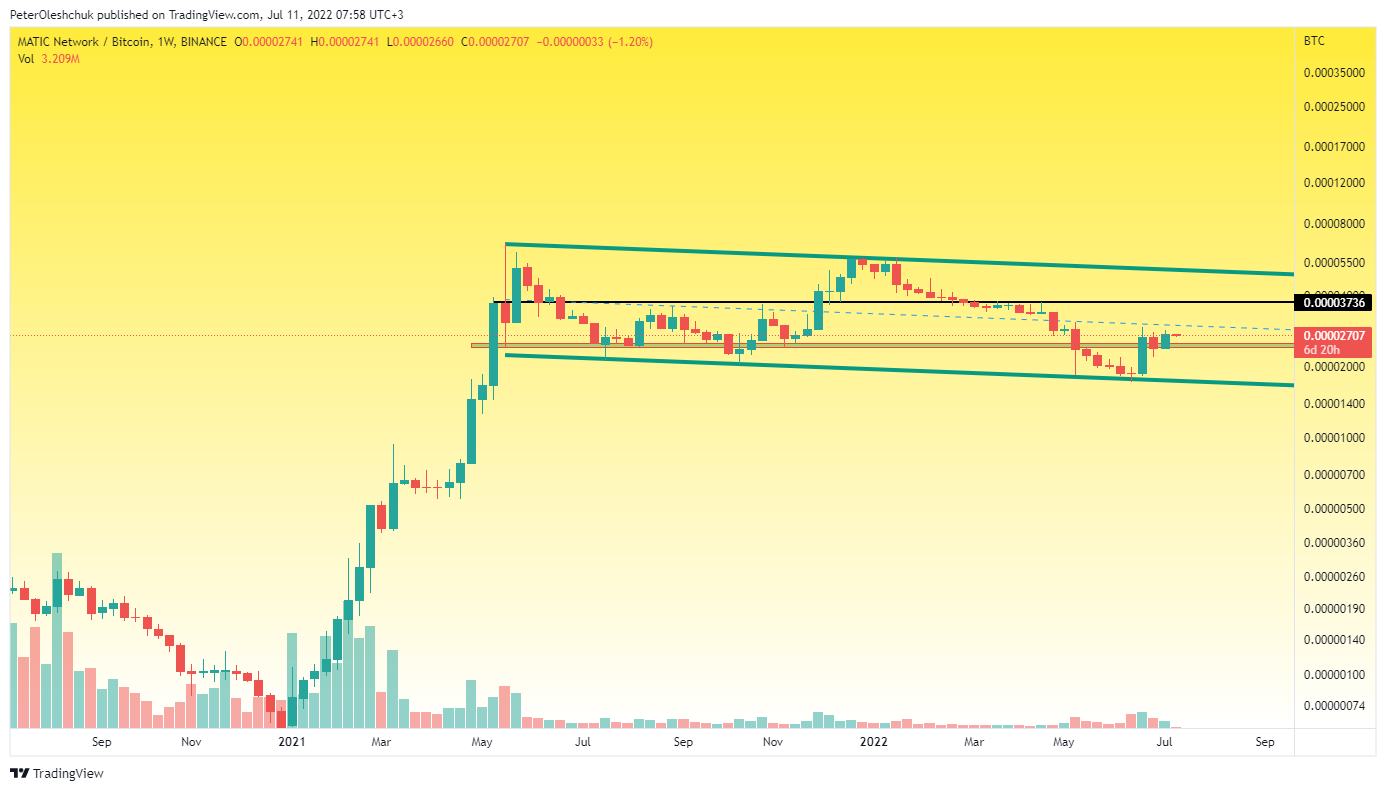 Source: https://www.tradingview.com/x/MOApLNch/ The weekly MATIC chart is very similar to SOL in terms of its global structure. In both cases, we initially see a strong growth impulse, which is later corrected by a weak falling wave. Though, in the case of MATIC, the price of MATICBTC could keep above the important level of 0.000024. It was above this level that the MATICBTC price closed during the trading of the weekly candle on 9 May. Therefore, while buyers have under control the mark of 0.000024 - we expect the continuation of the MATIC price growth to 0.000037. The final target of buyers is the mark of 0.00005.