On 13 June, buyers began trying to change the situation in the SOL market. Trading volumes increased after establishing a local low of $25.86, and buyers managed to stop the price from falling. The SOL cryptocurrency stopped in the consolidation range of $30.8-$40.6, in which market participants measure their strength. Usually, increased trading volumes within the range of consolidation indicate a market reversal. Especially if there was a strong uncorrected trend before the consolidation. 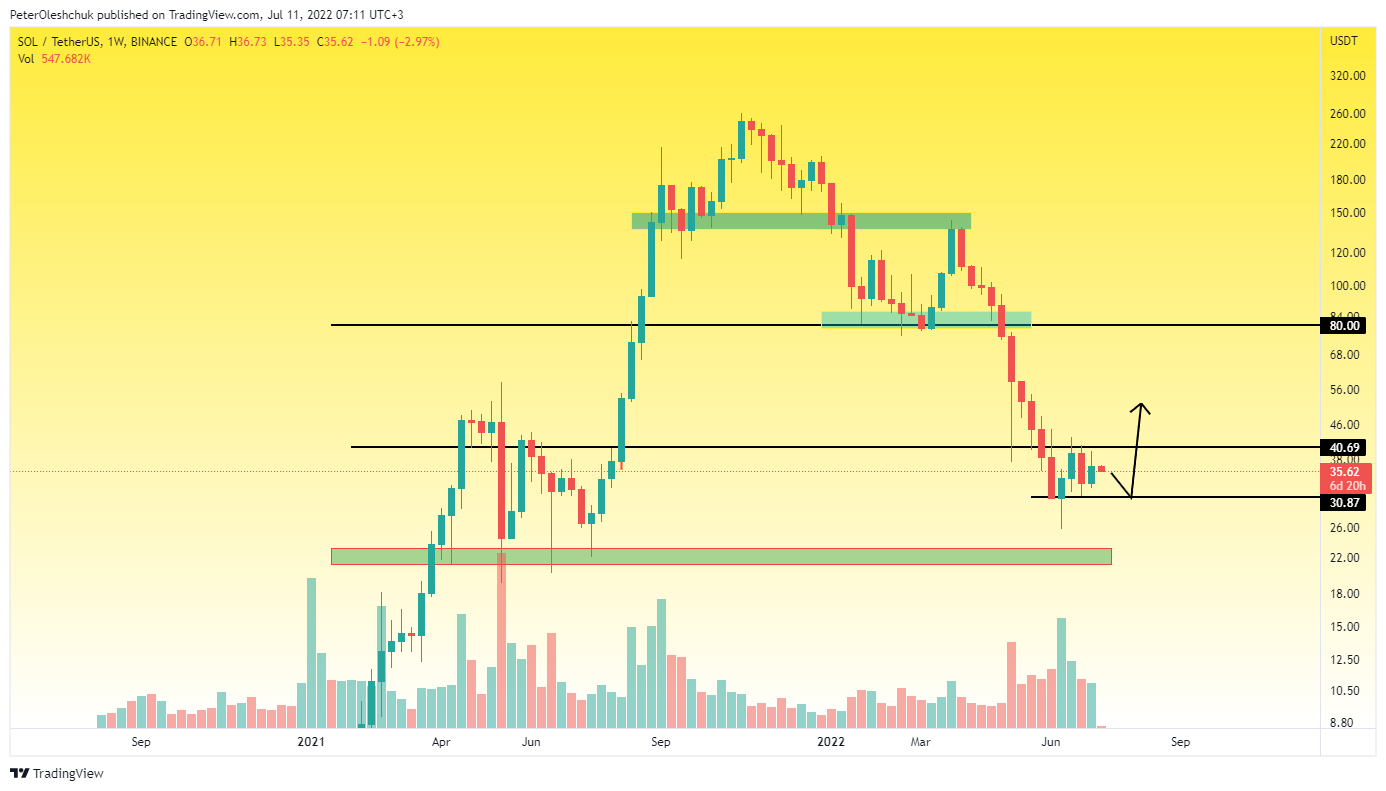 Source: https://www.tradingview.com/x/SI6umPEJ/ Therefore, keeping the mark of $30.8 by buyers in the near term will mean continued growth with a minimum target of $51.8. This target was the reason for the SOL correction in May 2021 and stopped buyers in a confident trend. However, when buying SOL in the range of $30.8, you should not neglect the stop order. The fact is that after breaking this mark, the next target of $22 will be opened for sellers. This mark is the key level on the weekly timeframe. From May to July 2021, buyers confidently held the $22 mark, which was the reason for the continued growth to $259. Thus, even breaking through the current downward consolidation will not cause a total collapse in the SOL market. The worst is over.
SOL Technical Analysis On The Daily Timeframe
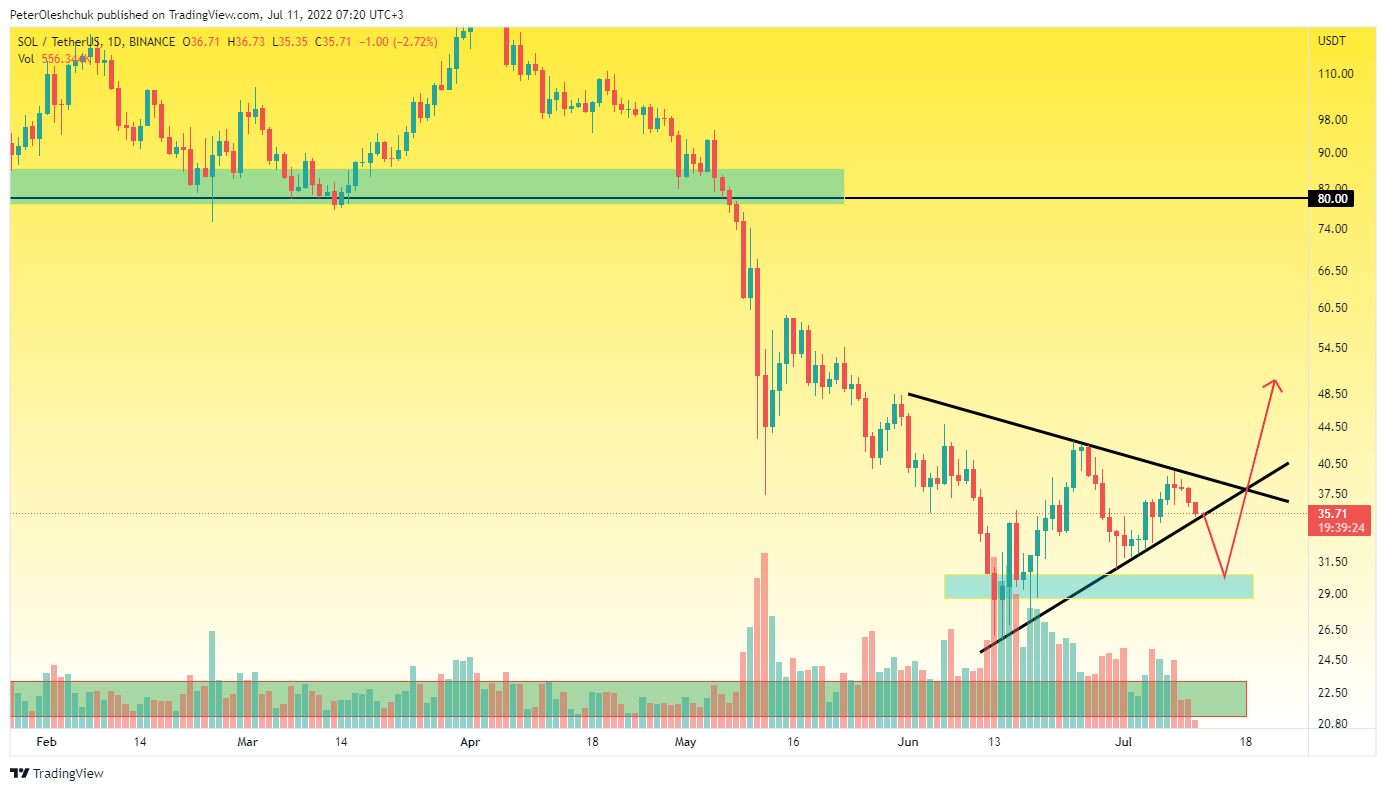 Source: https://www.tradingview.com/x/YoTHFU9L/ Analyzing the movement of the SOL price on the daily timeframe, you can notice a triangle in which the SOL price potentially moves from 1 June. The lower trend line of this triangle and the SOL price have met and now it will become clear whether buyers will in principle be allowed to reach the mark of $30.8. If the $35 range keeps, we will see a strong growth impulse, with $51.8 as the first target. Loss of control by buyers of the $35 mark will confirm the fact that they have not yet acquired the required number of positions. On the trading history, from 13 June to 30 June, we see that trading volumes increased precisely when sellers tried to break the $30.8 mark. Therefore, if we see the test of this range again and at the same time the daily candles will be small, and the trading volumes will increase - it is worth buying SOL for your investment portfolio.
SOLBTC Price Hints At A Deeper Correction
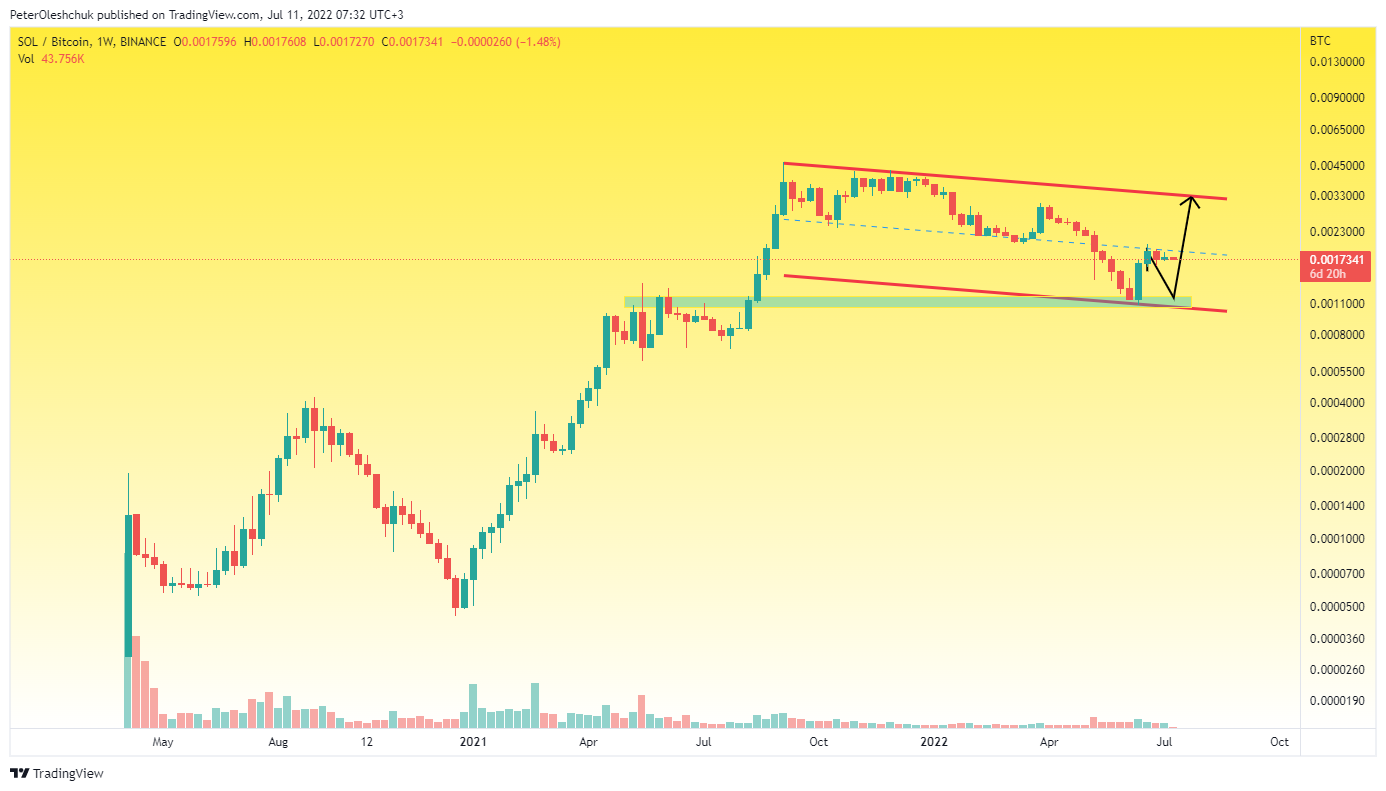 Source: https://www.tradingview.com/x/lMhl9qdv/ The weekly chart of SOLBTC shows that SOL upward bounce may have ended. For 4 weeks, SOLBTC price is near the 0.0019 range. Within this range is the middle line of the corrective channel in which SOLBTC has been moving since August 2021. If sellers manage to fix below 0.0016, we should expect the SOLBTC price near the 0.0011 range. Keeping the price near the 0.0016 range will show that buyers are not allowing sellers to organize a deep correction. So, the full initiative is on the side of the buyers and there is a strong growth impulse ahead with the first target at 0.0033. This growth impulse will not break the correction structure of sellers from September 2021. That is, from this mark, the global SOLBTC correction can continue, even updating the local low.