Aave price analysis reveals that the market is currently in a bullish trend. The immediate resistance for AAVE is present at $74.94. If the price breaks above this level, it may continue to rise towards $84.17. On the other hand, if the price fails to break above $74.94, it may retrace towards $63.03. AAVE price analysis is bullish today as the market continues to rise.
AAVE/USD pair is currently trading at $70.84 and is up by over 3 percent in the past 24 hours. The market has been on a strong uptrend since yesterday as it surged from $68.50 to its current price. The market is expected to continue this upward trend as the market cap for AAVE stands at $958 million, and the 24-hour trading volume is at $339 million.
Aave price analysis for 1-day: AAVE/USD price continues to move higher
The daily Aave price analysis reveals that the market has seen some consolidation in the past week as prices have been fluctuating between $63 .03 and $74.94 However, the market has now surged above the $70 mark and is trading at $70.84. The market is expected to continue this upward trend as there are no major resistances present till $84.17.
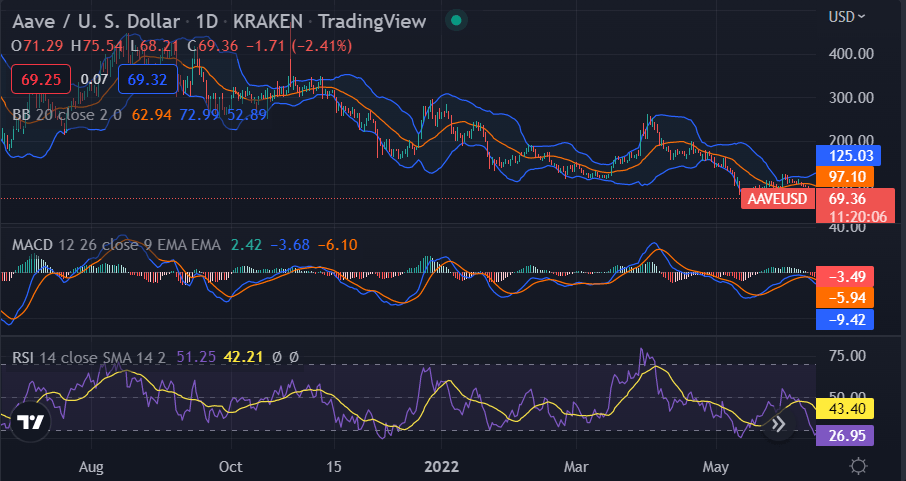 AAVE/USD 1-day price chart, source: TradingView
The volatility in the one-day price chart is low as the upper Bollinger Band is at $71.07 and the lower Bollinger Band is at $69.61. The MACD line is currently above the signal line, and a crossover is about to occur. This indicates that the market may see some consolidation in the short term. The RSI for AAVE/USD is currently at 64.46, which indicates that the market is neither overbought nor oversold.
Aave price analysis on a 4-hour price chart: AAVE faces rejection at $74.94
The four-hour Aave price analysis shows that the market has been on a strong uptrend for the last 4-hours as AAVE/USD is seen trading inside an ascending channel. The market made an attempt to break out of this channel a few hours ago but was rejected at $74.94. The market may now retrace towards the support line of the ascending channel, which is currently at $67.
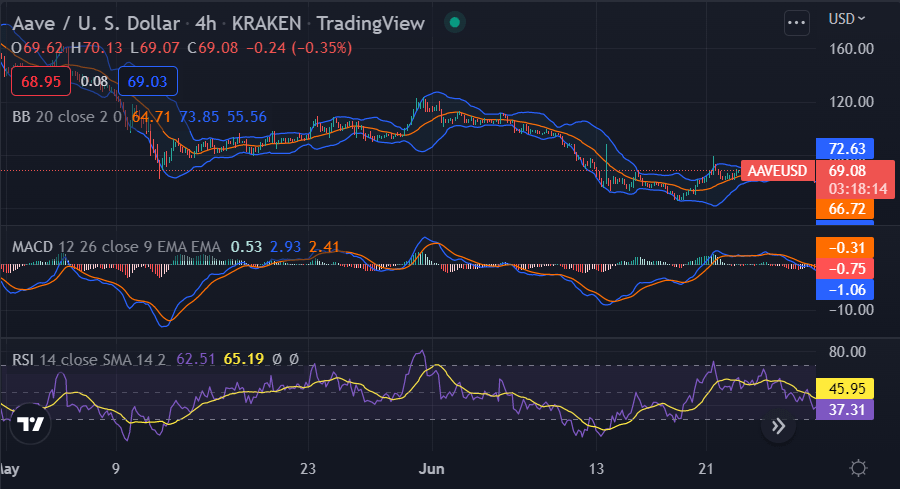 AAVE/USD 4-hour price chart, source: TradingView
The Bollinger Bands for AAVE on the 4-hour chart have widened, and the Bollinger Band width indicator is currently at 1.43. This indicates that the market is seeing high volatility. The MACD line for AAVE/USD currently moving above the signal line which is a bullish sign. The RSI for the market is currently at 54.32 and is slowly moving towards the overbought region.
Aave price analysis conclusion
The overall Aave price analysis is bullish as the market continues to move higher. The market may face some consolidation in the short term, but the overall trend is bullish. The technical indicators on the 4-hour and 1-day charts are currently giving bullish signals which support the Aave price analysis. Investors are advised to buy the dips as the market is expected to continue its upward trend.
Disclaimer. The information provided is not trading advice. Cryptopolitan.com holds no liability for any investments made based on the information provided on this page. We strongly recommend independent research and/or consultation with a qualified professional before making any investment decisions.