- Support for EOS moving forward – $2.24, $2.16, $2.02, $1.90, $1.74, $1.64.
- Resistance for EOS moving forward – $2.35, $2.56, $2.87, $2.99, $3.19.
Latest EOS News
Only 7 months post-launch and EOS already has at least 260 projects building dapps on their blockchain. According to the EOS team, developers are attracted to develop on EOS for various reasons such as its scalability, low latency and eco-friendliness.
EOS Price Analysis
EOS has seen a 3.57% price decline over the past 24 hours of trading, bringing the current trading price down to around $2.25, at the time of writing. EOS has now seen a 5.34% price drop over the past 7 trading days, with a further 13.96% price fall over the past 30 trading days.
Now ranked in 5th position, EOS currently holds a $2.02 billion market cap valuation.
EOS/USD Price
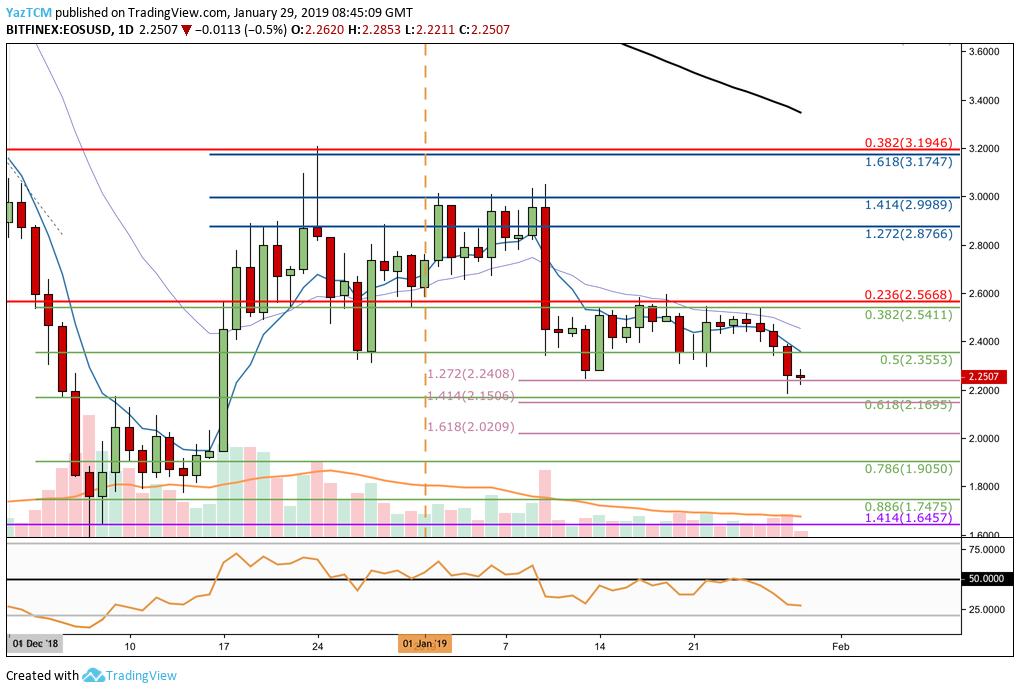
From the EOS/USD price chart above, we can see that EOS has recently broken below our previously identified support level at the short-term .5 Fibonacci Retracement level (drawn in green) priced at $2.35.
The market continued to fall lower until support was found at the short-term downside 1.272 Fibonacci Extension level (drawn in lilac) priced at $2.24. As the market reached this area, the price fall ceased.
EOS/USD is now trading marginally above this level of support.
Trend: Neutral
The current trading trend is still neutral until price action breaks and closes (on the daily) below the $2.24 handle.
For this market to be considered bullish, price action would have to rise and break above the $2.56 handle.
Where is EOS/USD Likely to Head towards Next?
If the bulls can defend the support at $2.24 and cause price action to bounce higher, we can expect immediate resistance towards the upside at the short-term .5 FIbonacci Retracement level (drawn in green) priced at $2.35.
Further resistance above this level can then be expected at the bearish .236 Fibonacci Retracement level (drawn in red) priced at $2.56. This bearish Fibonacci Retracement level is measured from the high seen in November 2018 to the low seen in December 2018.
If EOS/USD climbs even higher, there is higher resistance at the short-term 1.272 and 1.414 Fibonacci Extension level (drawn in blue) priced at $2.87 and $2.99, respectively.
If the bullish pressure causes EOS/USD to break above $3.00, then higher resistance can be expected at the bearish .382 Fibonacci Retracement level (drawn in red) priced at $3.19.
What if the Bears Push EOS Below $2.24?
If the sellers cause EOS/USD to break below the $2.24, we can expect immediate further support below at the short-term .618 Fibonacci Retracement level (drawn in green) priced at $2.16. This is followed by more support at the short-term downside 1.618 Fibonacci Extension level (drawn in lilac) priced at $2.02.
If EOS/USD breaks below $2.00, further support beneath can be located at the short-term .786 and .886 Fibonacci Retracement level (drawn in green), priced at $1.90 and $1.74 respectively.
EOS/BTC Price
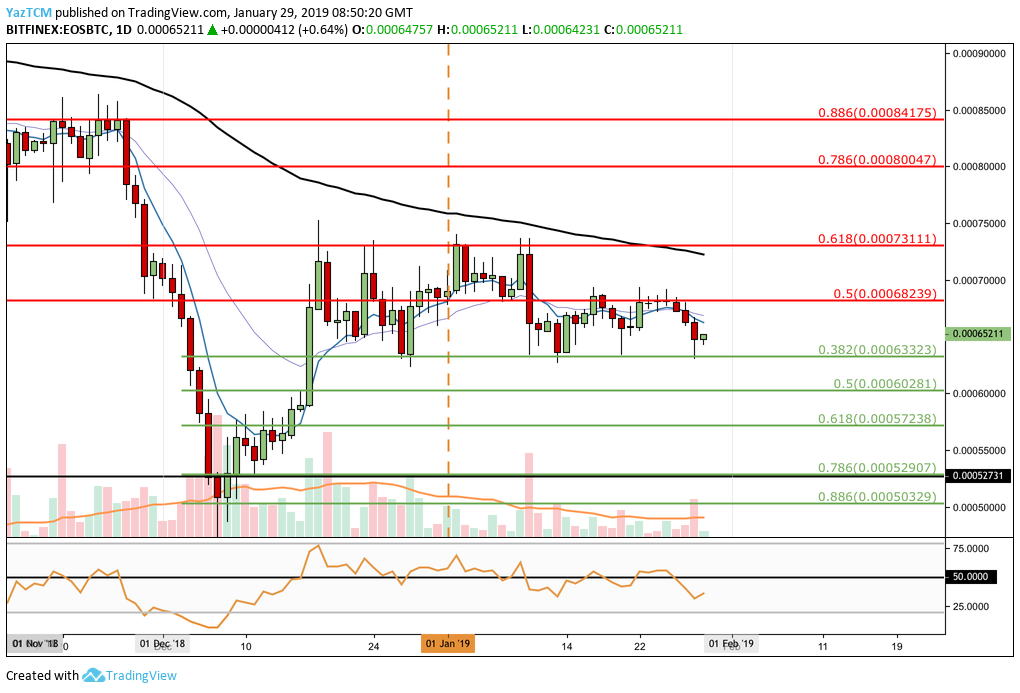
Analyzing the EOS/BTC daily chart above, we can see that price action has recently turned downward from the resistance at the bearish .5 Fibonacci Retracement level (drawn in red) priced at 68,239 SATS.
EOS/BTC then fell until it reached support at the short-term .382 Fibonacci Retracement level (drawn in green) priced at 63,323 SATS.
After reaching this area of support, price action bounced and is now trading at 65,211 SATS.
Trend: Neutral
The market is still trading within the range between 68,239 SATS and 63,323 SATS, and therefore the trend is still neutral.
For this market to be considered bearish, we would need to see a break below the trading range. Price action breaking above the upper boundary of the range would indicate a bullish turn.
Where Could EOS/BTC Head towards Next?
If the bulls can hold at the support at the bottom of the trading range and push EOS/BTC higher, we can expect immediate higher resistanceat the upper boundary of the range at 68,239 SATS.
If EOS/BTC goes even higher, there is more resistance at the bearish .618 Fibonacci Retracement level (drawn in red) priced at 73,111 SATS.
Further resistance towards the upside can then be expected at the bearish .786 and .886 Fibonacci Retracement levels (drawn in red), priced at 80,047 SATS and 84,175 SATS respectively.
What if the Sellers Push EOS/BTC Lower?
Alternatively, if the sellers begin to push price action lower and penetrate below the lower boundary of the trading range at 63,323 SATS, we can expect immediate support at the short-term .5 and .618 Fibonacci Retracement level (drawn in green), priced at 60,281 SATS and 57,238 SATS respectively.
If the sellers continue to push EOS/BTC below the 55,000 SATS handle, there is more support below at the short-term .786 and .886 Fibonacci Retracement level (drawn in green), priced at 52,907 SATS and 50,329 SATS respectively.
Conclusion
EOS is trading comfortably within the trading range identified above.
We will be closely watching price action over the following few days to see if the support at $2.24 can hold. If the EOS market does break below, we can expect the selling pressure to continue to increase and push EOS/USD much lower.