MATIC price showcase a gradual bullish reversal challenging the overhead resistance at the 50-day SMA. Will the reversal rally exceed the SMA? Key technical points:
- The MATIC market price action shows a bullish reversal from the $0.46 mark.
- The reversal rally teases a cup and handle pattern formation in the daily chart.
- The 24-hour trading volume of Polygon is $646 Million, indicating a rise of 62%.
Past Performance of MATIC
The bullish failure to surpass the 50-day SMA results in a bearish retracement under the $.50 mark to test the $0.46 support level. Finally, the buyers overtake the train control to rechallenge the 50-day SMA with a cup and handle pattern formation. 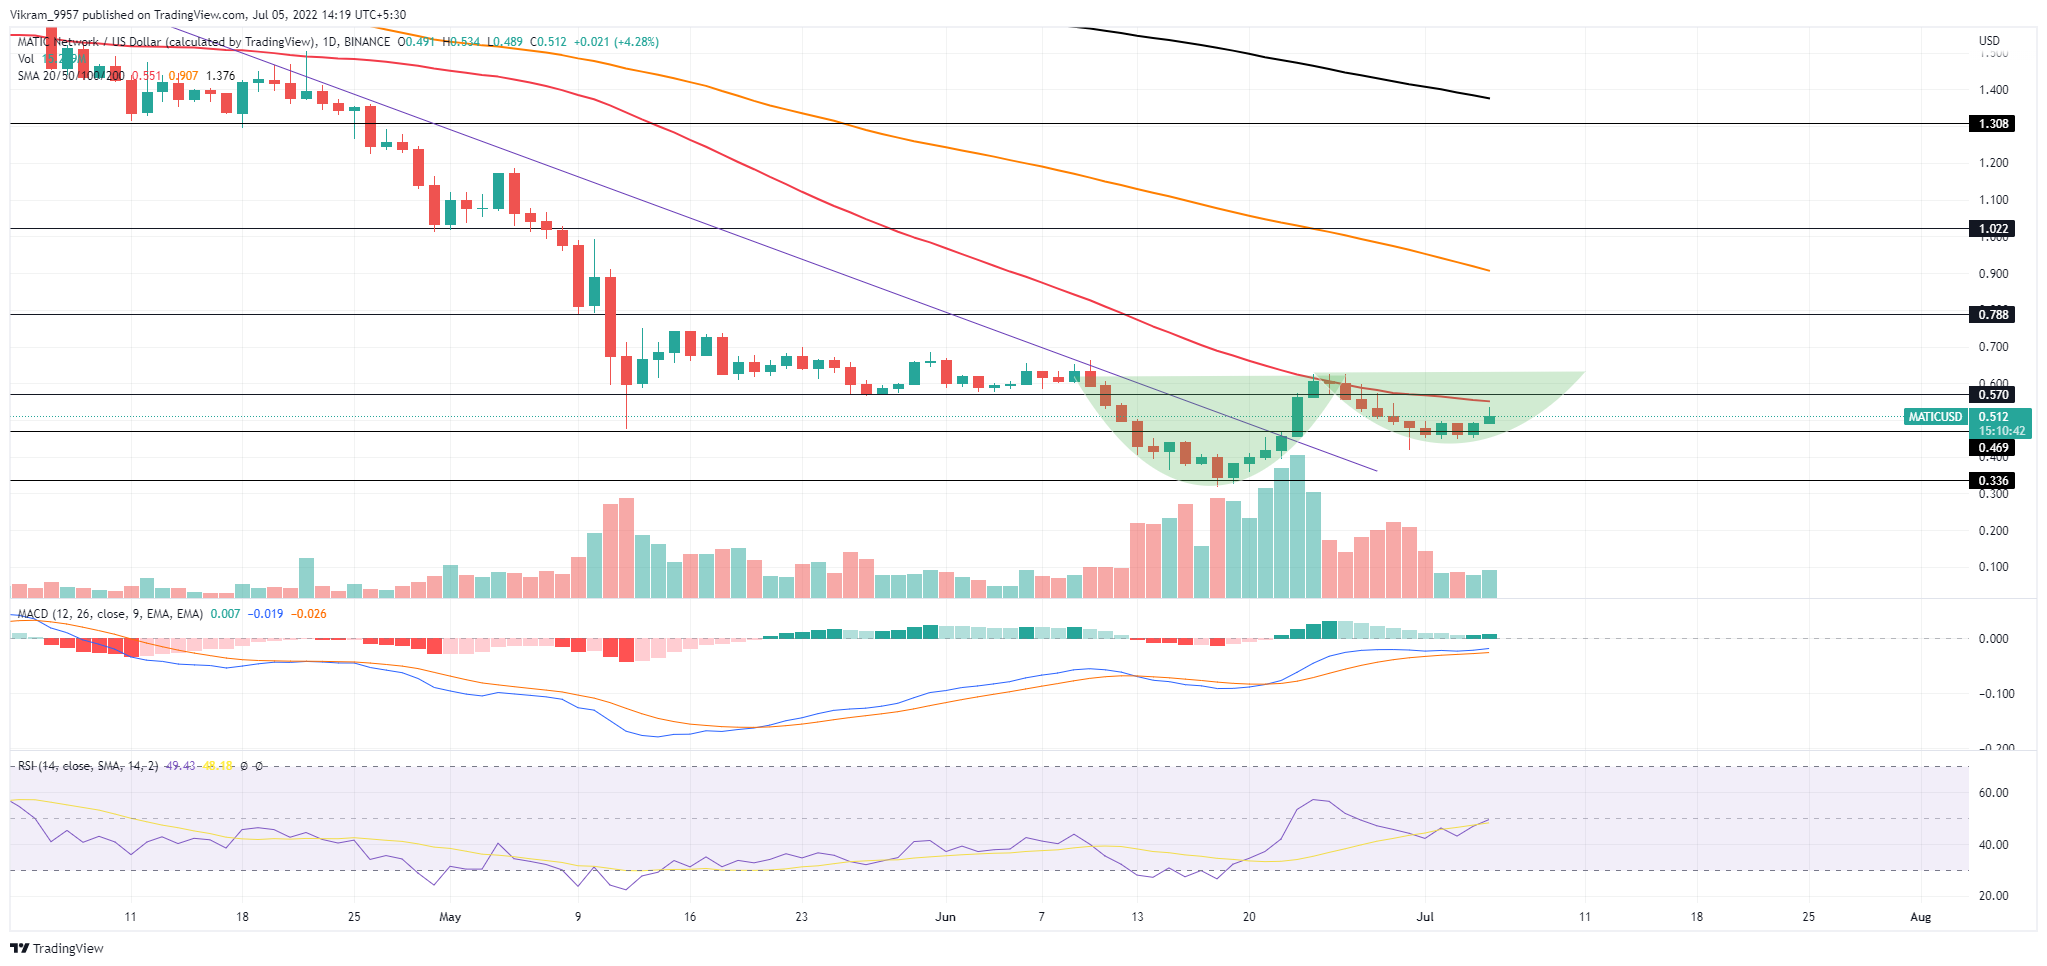 Source- Tradingview
MATIC Technical Analysis
MATIC price Action showcases the $0.61 level acting as the neckline of the cup and handle formation. Traders can expect a breakout rally to reach the overhead resistance at $0.78 if the prices surpass the 50-day SMA. The MACD indicator Showcases a bullish trend of the fast and slow lines after avoiding a bearish crossover event. Hence the indicator showcases a bullish trend in motion, increasing the likelihood of a bullish breakout. The RSI indicator showcases a double bottom reversal in the nearly oversold zone resulting in a jump over the 14-day average line to reach the halfway line. Hence the indicator showcases a remarkable growth in the underlying bullishness, adding points to the breakout possibility. Hence the technical indicators maintain a bullish trend in motion, but the growing bearish influence in the daily candle may result in a bearish reversal. In a nutshell, the MATIC price analysis showcases a rise in buying pressure but suggests waiting for a price action confirmation.
Upcoming Trend
If the buying pressure continues to grow, the MATIC prices will surpass the opposing 50-day SMA. Traders can expect the breakout rally to reach the next resistance level at $0.78 Resistance Levels: $0.57 and $0.78 Support Levels: $0.46 and $0.33