Apart from the excessive fluctuations in the market lately, prices all the top-ten leading cryptocurrencies have undergone a major decline as observed in the past 24 hours. The fate of Tron [TRX], currently ranked eighth on the CoinMarketCap, is no different. Over the weekend, the price of TRX treaded steadily, however, dropped a massive rate of 9.73% during the early hours of Monday.
At the time of writing, the coin has exhibited a market cap of $1.79 billion. Priced at $0.027, the coin registered a trading volume of $411.9 million.
1-hour
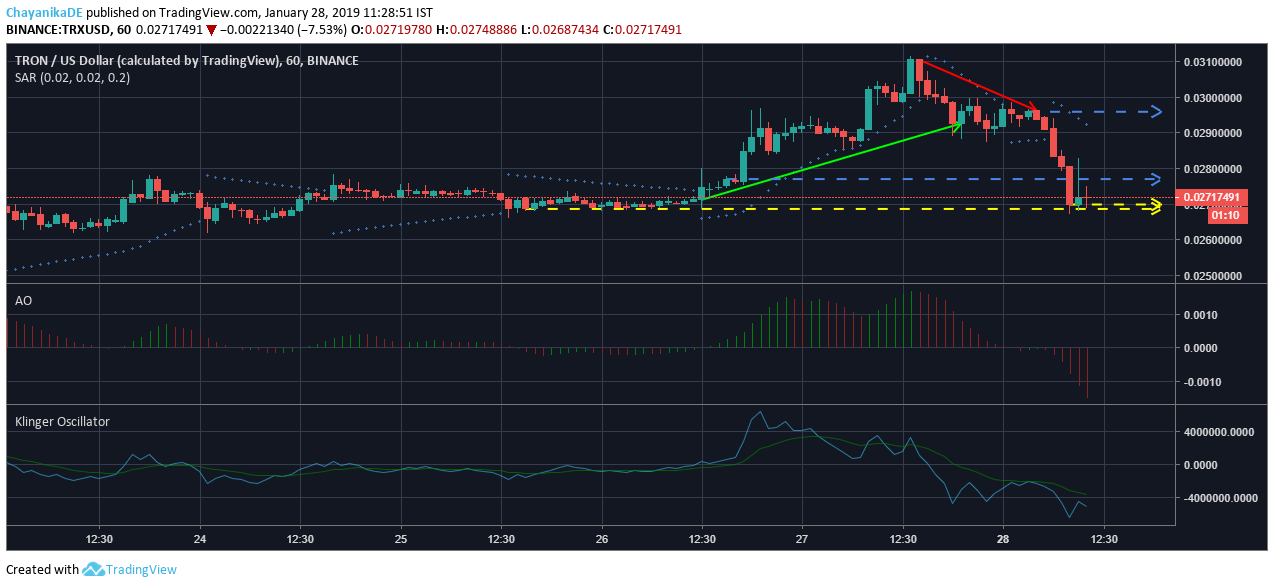
Source: Trading View
During the short-term one-hour price prediction of the coin, an uptrend from $0.027 to $0.029 and a downtrend from $0.031 to $0.030 was recorded. The immediate resistance for the coin was marked at $0.027, with the price of the coin gearing very close to the resistance. The second resistance is marked at $0.030 and two supports were noted at $0.027 and $0.026.
Parabolic SAR indicates the coin heading towards a bearish zone with the dotted lines aligned above the candles.
Awesome Indicator shows a bearish price movement for the coin.
Further, the signal line is treading above the reading line on the Klinger Oscillator chart, depicting a bearish trend.
1-day
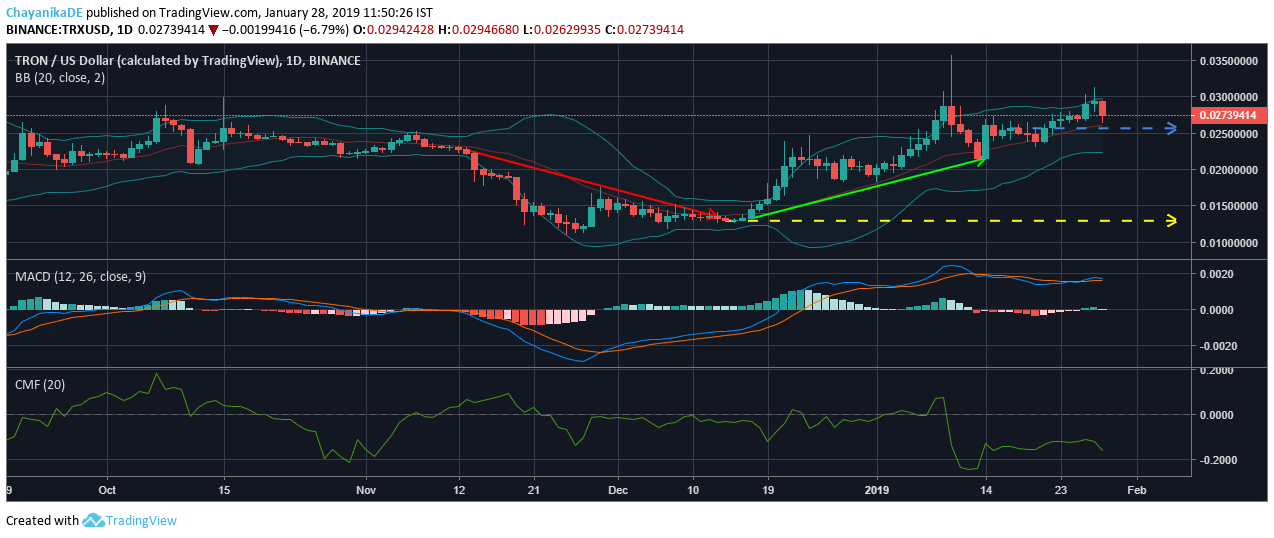
Source: Trading View
During the one-day overview, the valuation of the coin ascended from $0.014 to $0.021 and recorded a significant downtrend of $0.022 to $0.013. A resistance of $0.025 has been noted and immediate support is marked at $0.013.
The converging Bollinger Bands depicts low price volatility in the coin’s price. The moving average line points to a bullish trend for the coin.
The MACD indicator also pictures the coin heading towards a bullish zone with the MACD line positioned on top of the Signal line.
The Chaikin Money Flow indicates a bearish trend with the graph spiraling below the zero-line, depicting an outflow of money from the market.
Conclusion:
The short-term technical analysis of TRX predicts its price movements in the bear’s loop. However, the one-day analysis of the coin via MACD and BB depicts the coin’s price gearing towards the bullish zone. The CMF indicator for the latter time period also predicts a bearish market pattern for the coin.