XRP bulls had failed to push the price above $0.4 over the past few days and are now trying to form a higher low to preserve the last chances for a bullish structure. However, the market is still under bears control.
Technical Analysis
Technical Analysis By Grizzly
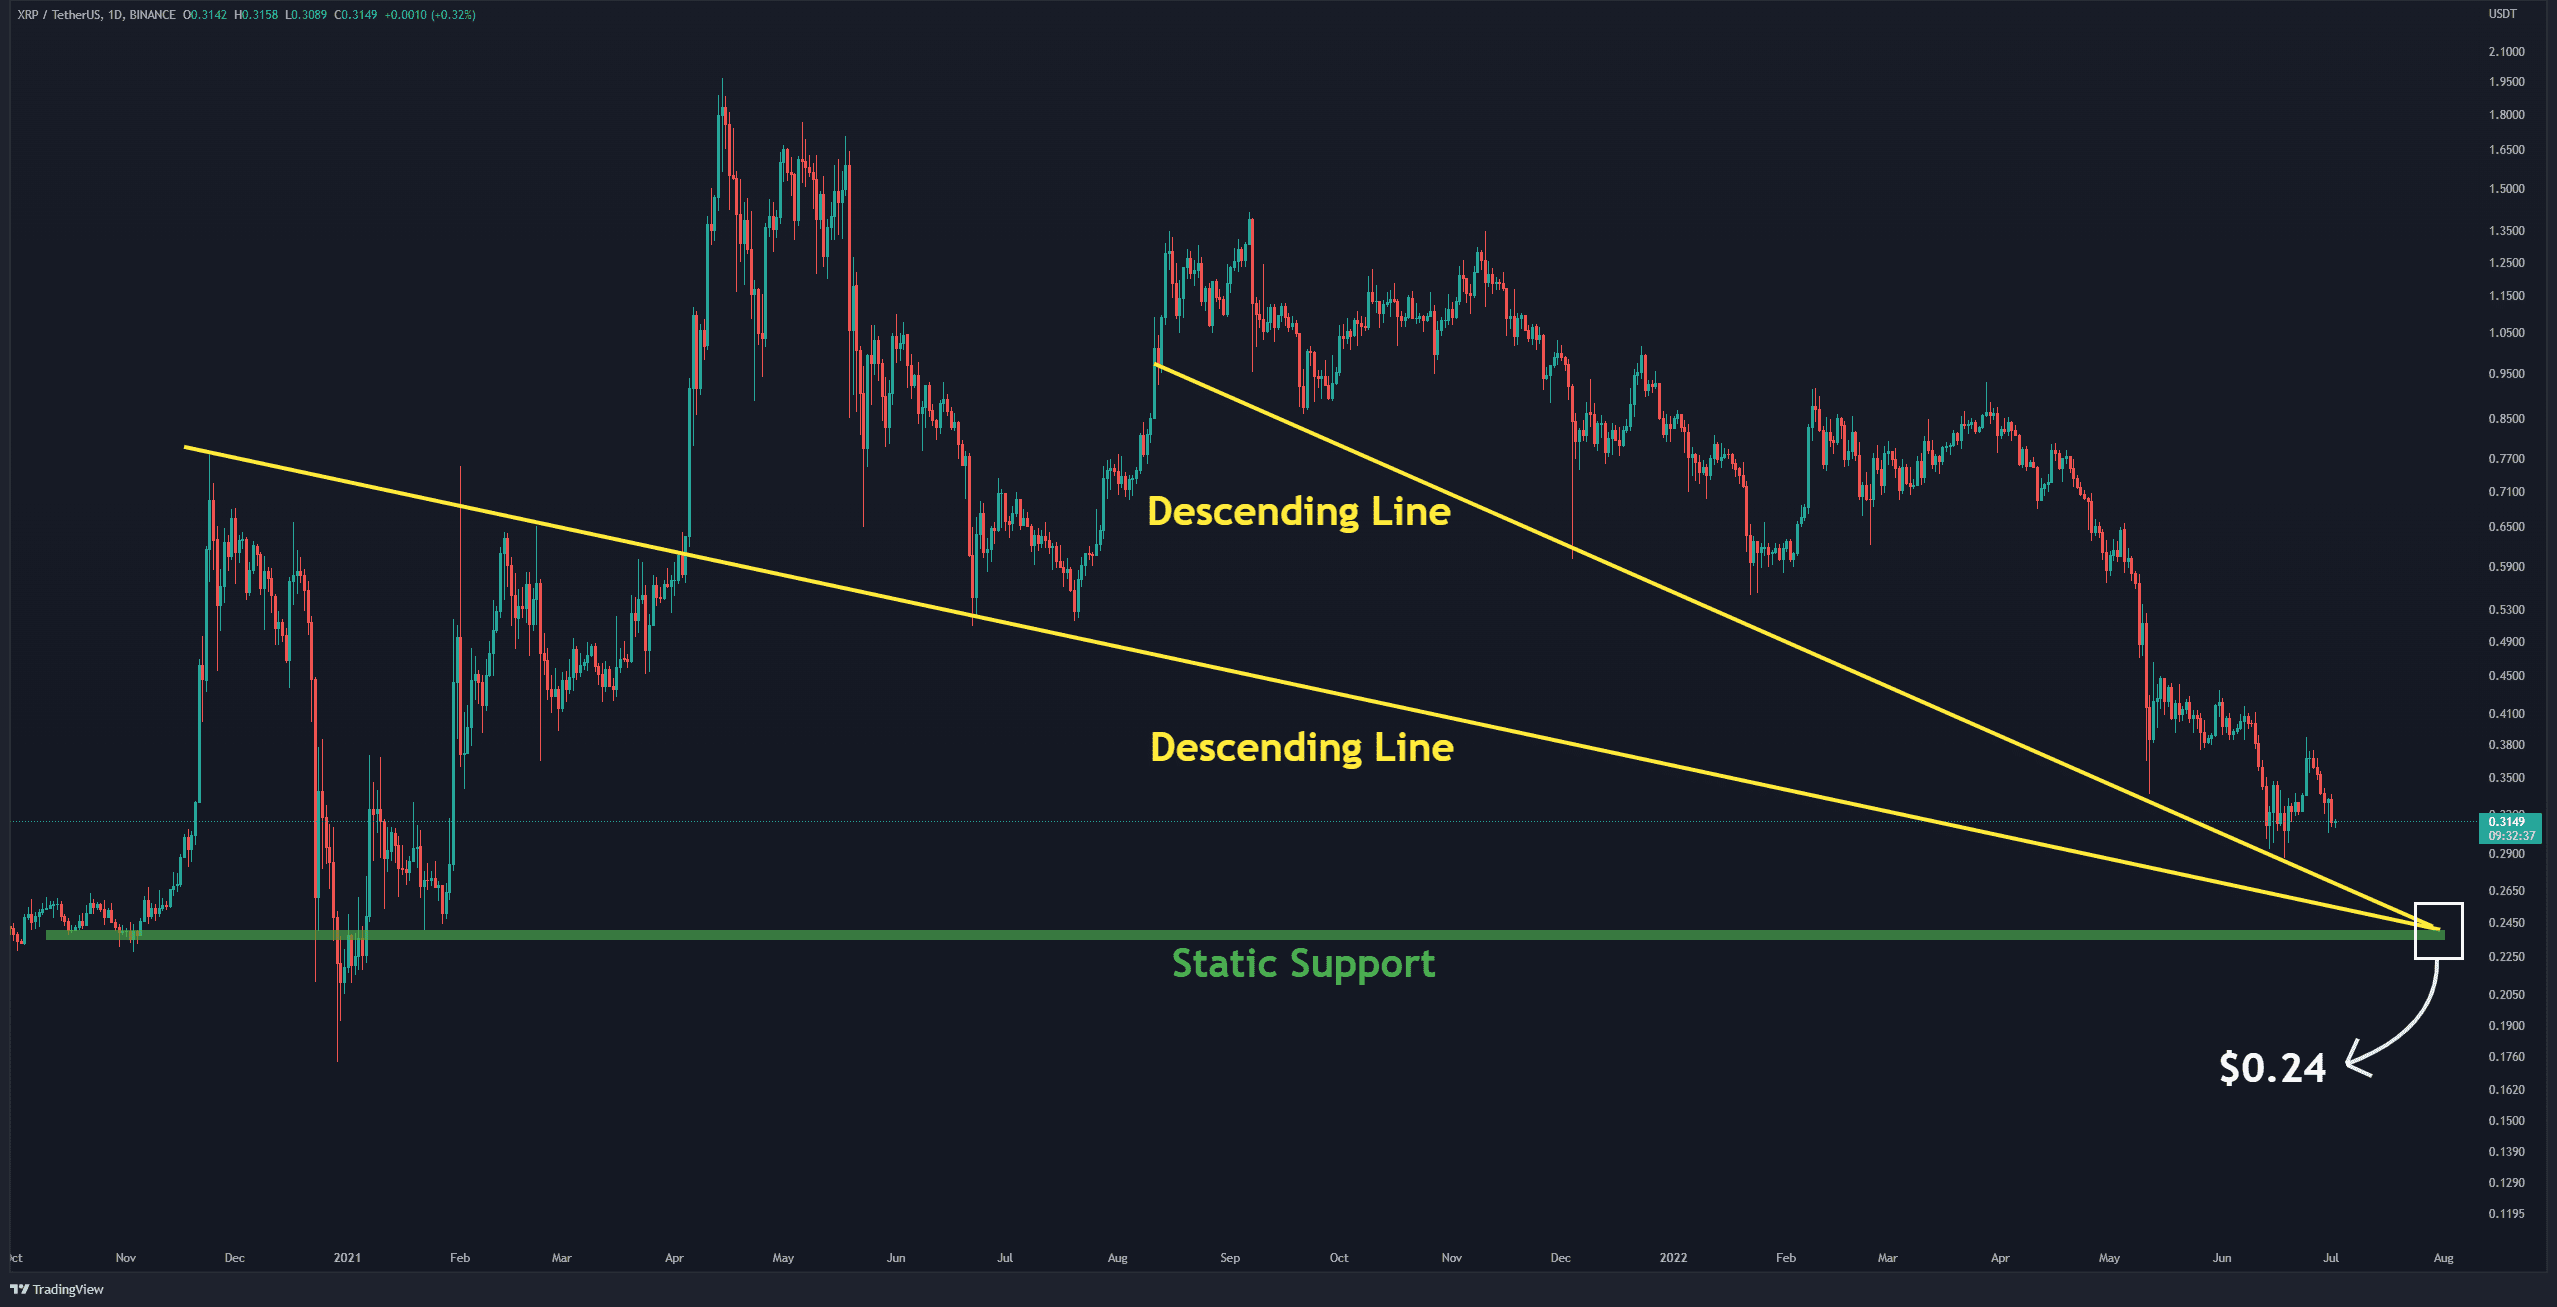
The Daily Chart
On the daily timeframe, Ripple has lost 15% of its value in the past seven days, as the bears were able to push the price down to $0.30.
The intersection of the two descending trendlines (in yellow) as support and long-term horizontal support (in green) lies at $0.24. This area can be considered a potential demand zone.
Given that most of the indicators are in the oversold zone, it is expected that if the price reaches this zone, it will initiate a short-term relief correction.
However, due to macroeconomic events, Ripple will probably experience many fluctuations in the range between $0.3 and $0.24.
Key Support Levels: $0.30 & $0.24
Key Resistance Levels: $0.38 & $0.45
Moving Averages:
MA20: $0.33
MA50: $0.37
MA100: $0.54
MA200: $0.65
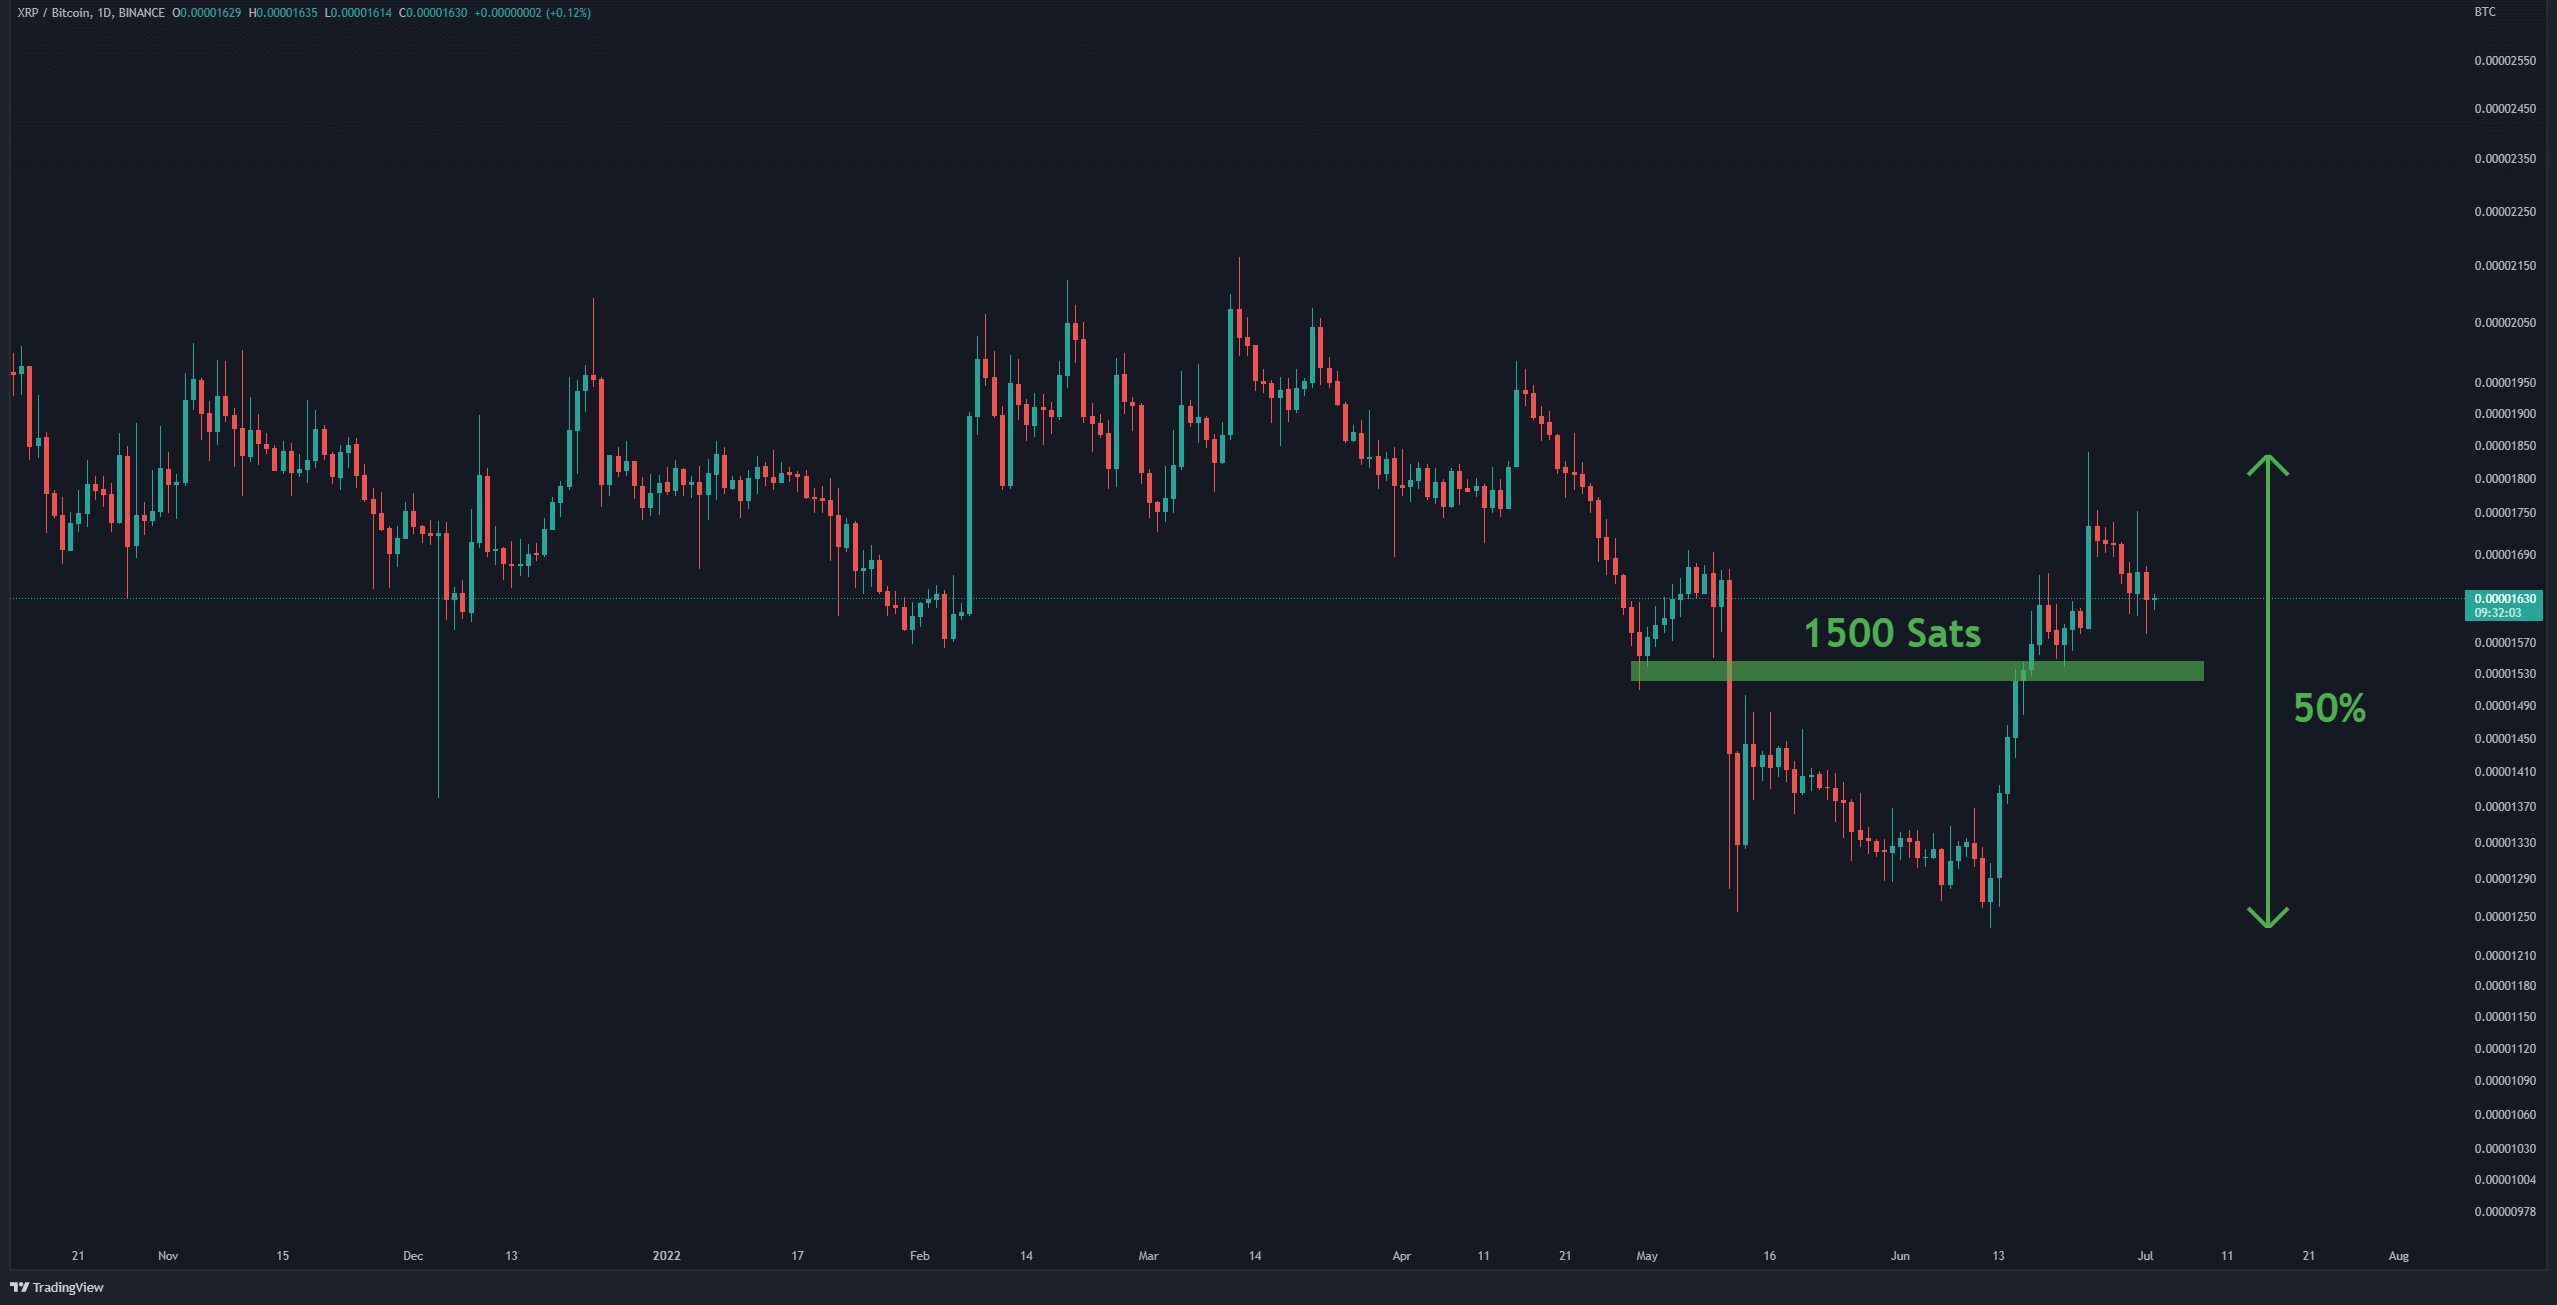
The XRP/BTC Chart
The situation in the BTC pair chart is a bit different.
The bulls were able to increase the price of Ripple against Bitcoin by 50%. This relief rally encountered horizontal resistance at 1800 SATs. Currently, the price has entered a corrective phase. If the buyers can defend the horizontal support at 1500 SATs (in green) and form a higher low, we can expect this price rally of XRP/BTC to continue higher.
Key Support Levels: 1500 Sats & 1250 SATs
Key Resistance Levels: 1700 Sats & 1800 SATs