- On July 2, the bullish DOT price analysis is at $8.38.
- DOT’s bearish market price analysis for July 2, 2022, is $5.69.
- Polkadot’s MA shows a downward trend.
In Polkadot (DOT) price analysis on July 2, 2022, we use price patterns, and Moving Average about DOT to analyze the future movement of the cryptocurrency.
Polkadot (DOT)
DOT is the native cryptocurrency of Polkadot. A blockchain interoperability system protocol was established in 2016. It is a sharded blockchain, which means that many different chains are connected to the same network, which allows them to process and transfer data between chains in parallel without sacrificing security.
Polkadot (DOT) Price Analysis
DOT price analysis on July 2 is 2022 is explained below within a four-hour time frame.
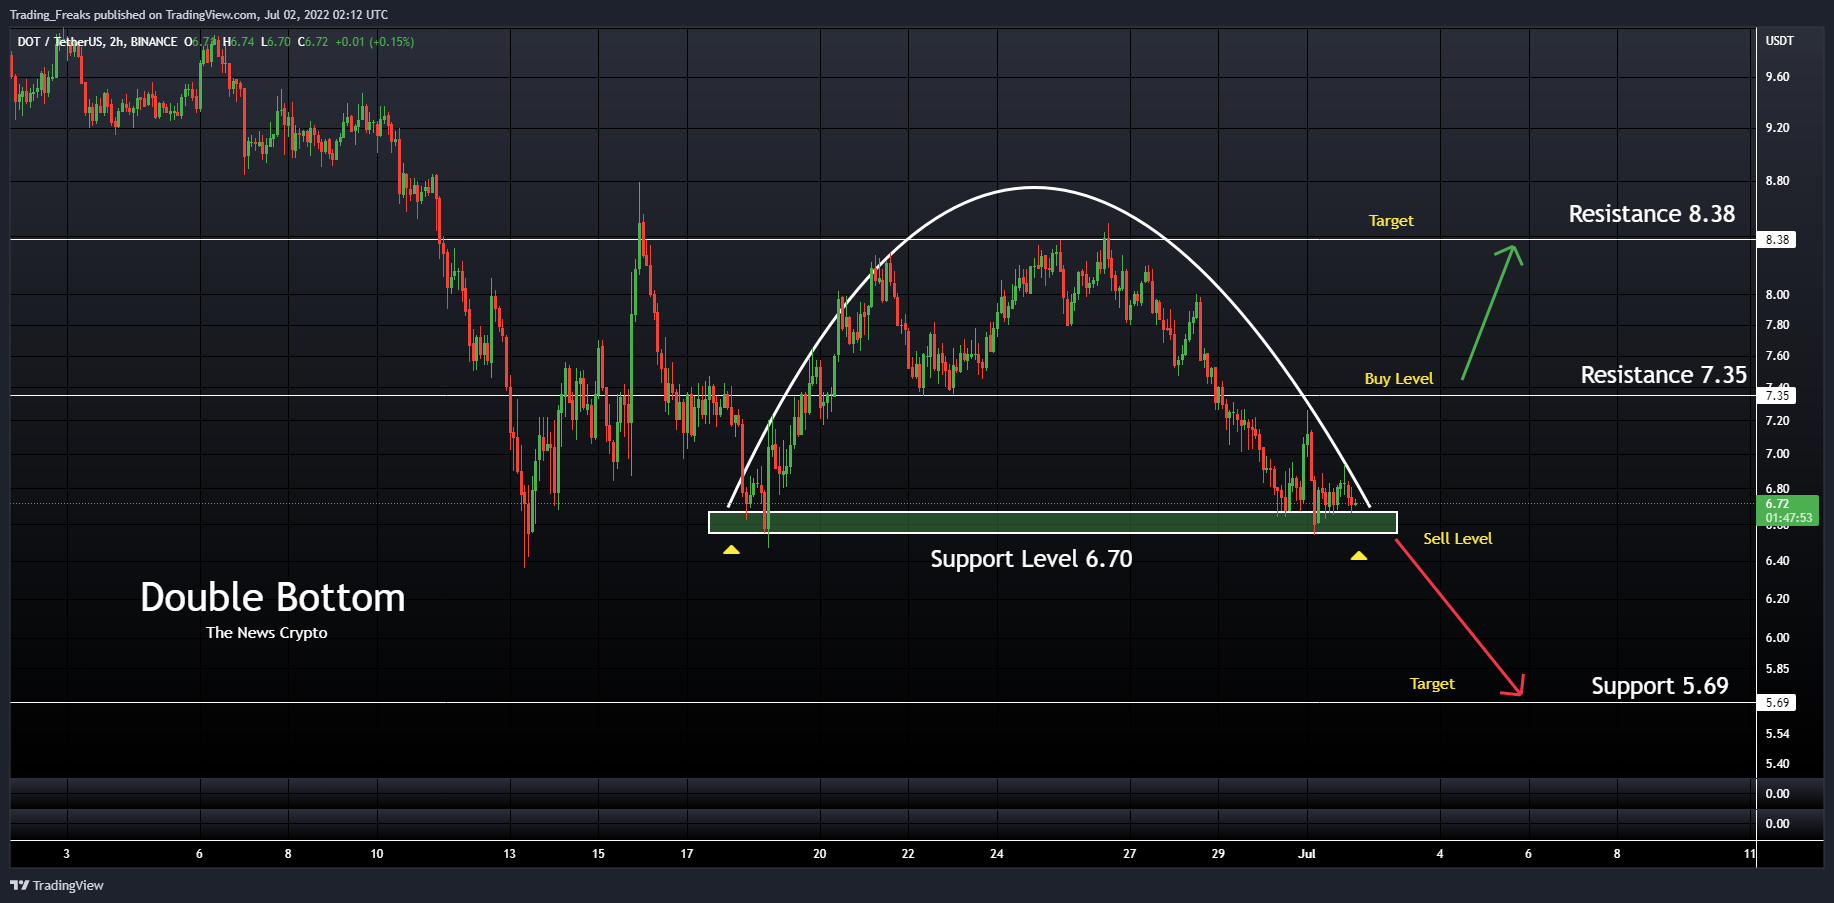
Hence more, the double bottom pattern consists of two low points forming near a similar horizontal price level which we have mentioned as the “Demand Zone” and that indicates a possible bullish reversal signal. Moreover, a measured price increase will occur between the two low points, indicating some support at the price lows.
Furthermore, the double bottom chart pattern, which depicts the letter “W,” appears at the end of a downtrend. Price falls to a new low, then rises slightly before falling back to the new low. Sellers give up after failing to push the price to a new lower low to continue the downtrend, and the price bounces sharply from this area.
Currently, the price of DOT is $7.83. If the pattern continues, the price of DOT might reach the resistance level of $8.38 and the buy level of $7.35 If the trend reverses, then the price of DOT may fall to $5.69.
Polkadot (DOT) Moving Average
The DOT’s Moving Average (MA) is shown in the chart below.
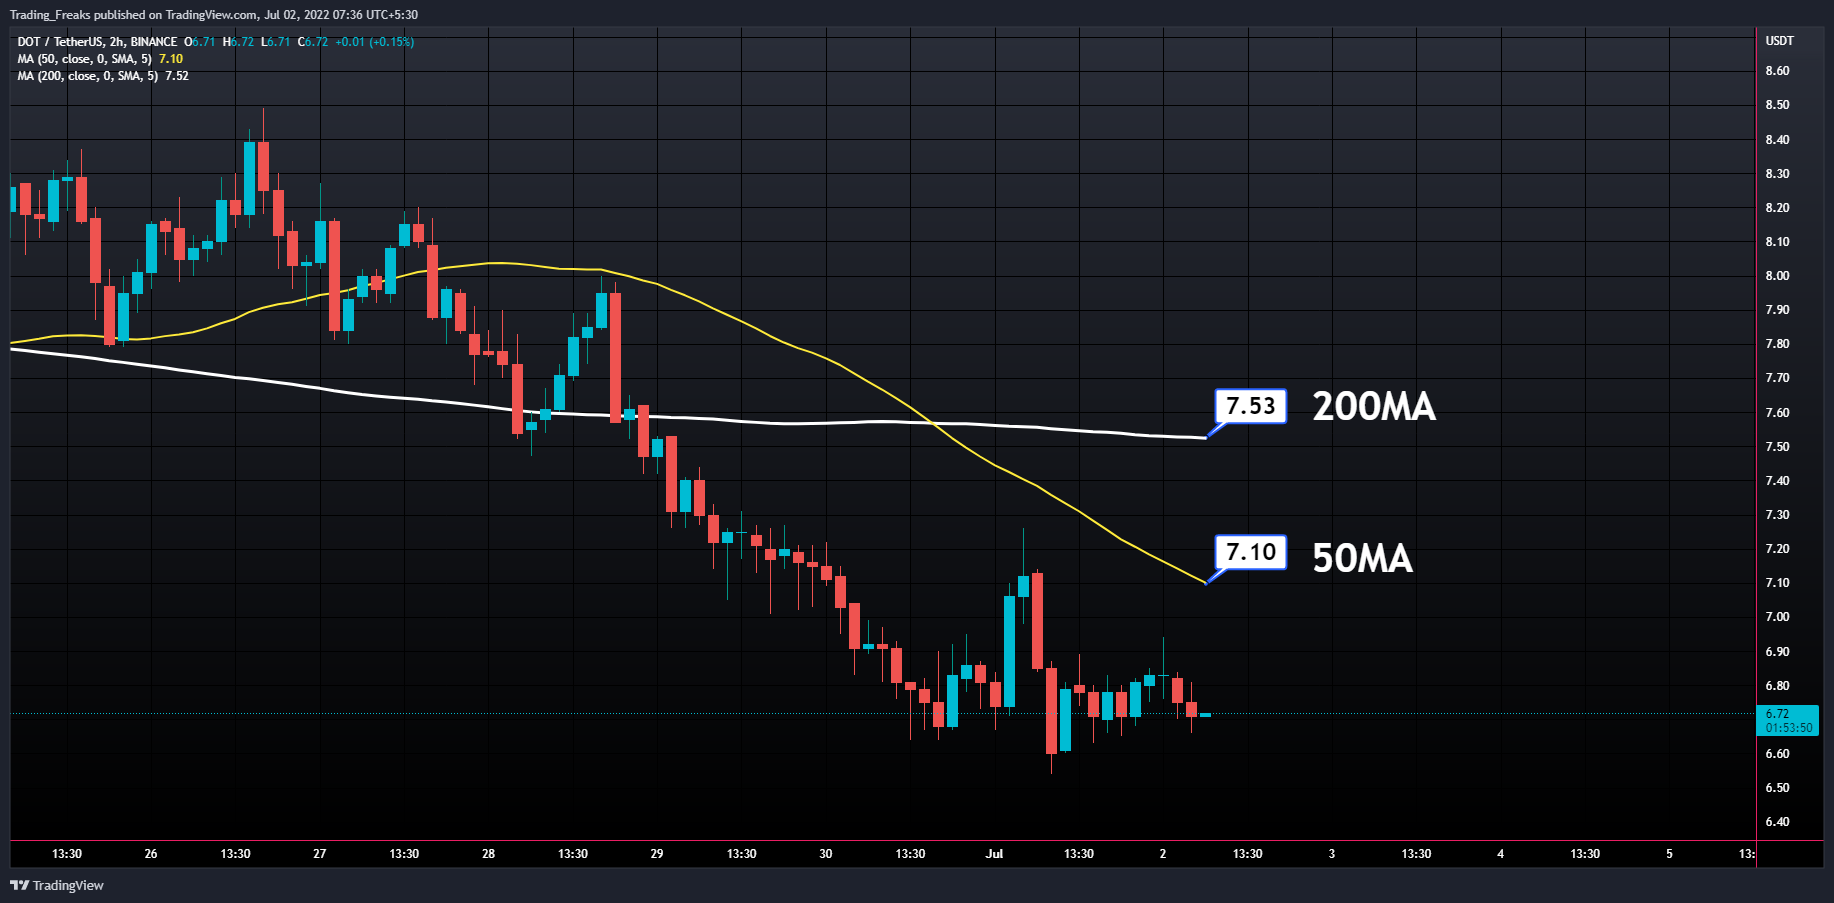
Currently, DOT is in a bearish state. Notably, the DOT price lies below 50 MA (short-term) and also lies below 200 MA (long-term). Henceforth, when DOT completely moves above 50 & 200 MA then it is said to be a bullish trend. Therefore, there is a possibility of a reversal trend of DOT at any time.
Disclaimer: The opinion expressed in this chart solely author’s. It does not interpreted as investment advice. TheNewsCrypto team encourages all to do their own research before investing.