KSM price action showcases a loss in bearish trend momentum under $50 increasing the likelihood of a bullish reversal to reach the 50-day SMA. Key technical points:
- The KSM prices maintain a sideways trend between $44 and $60.
- The price action shows a high likelihood of a bullish reversal rising above $50.
- The 24-hour trading volume of Kusama is $32.20 Million, indicating a rise of 10%.
Past Performance of KSM
KSM price action shows a sideways trend forming a consolidation range in the daily chart between the $40 and $60 marks almost for the last three weeks. The bear cycle within the range loses momentum evidenced by the small-bodied candle formations near the support level. Hence, the likelihood of a price jump to $60 increases. 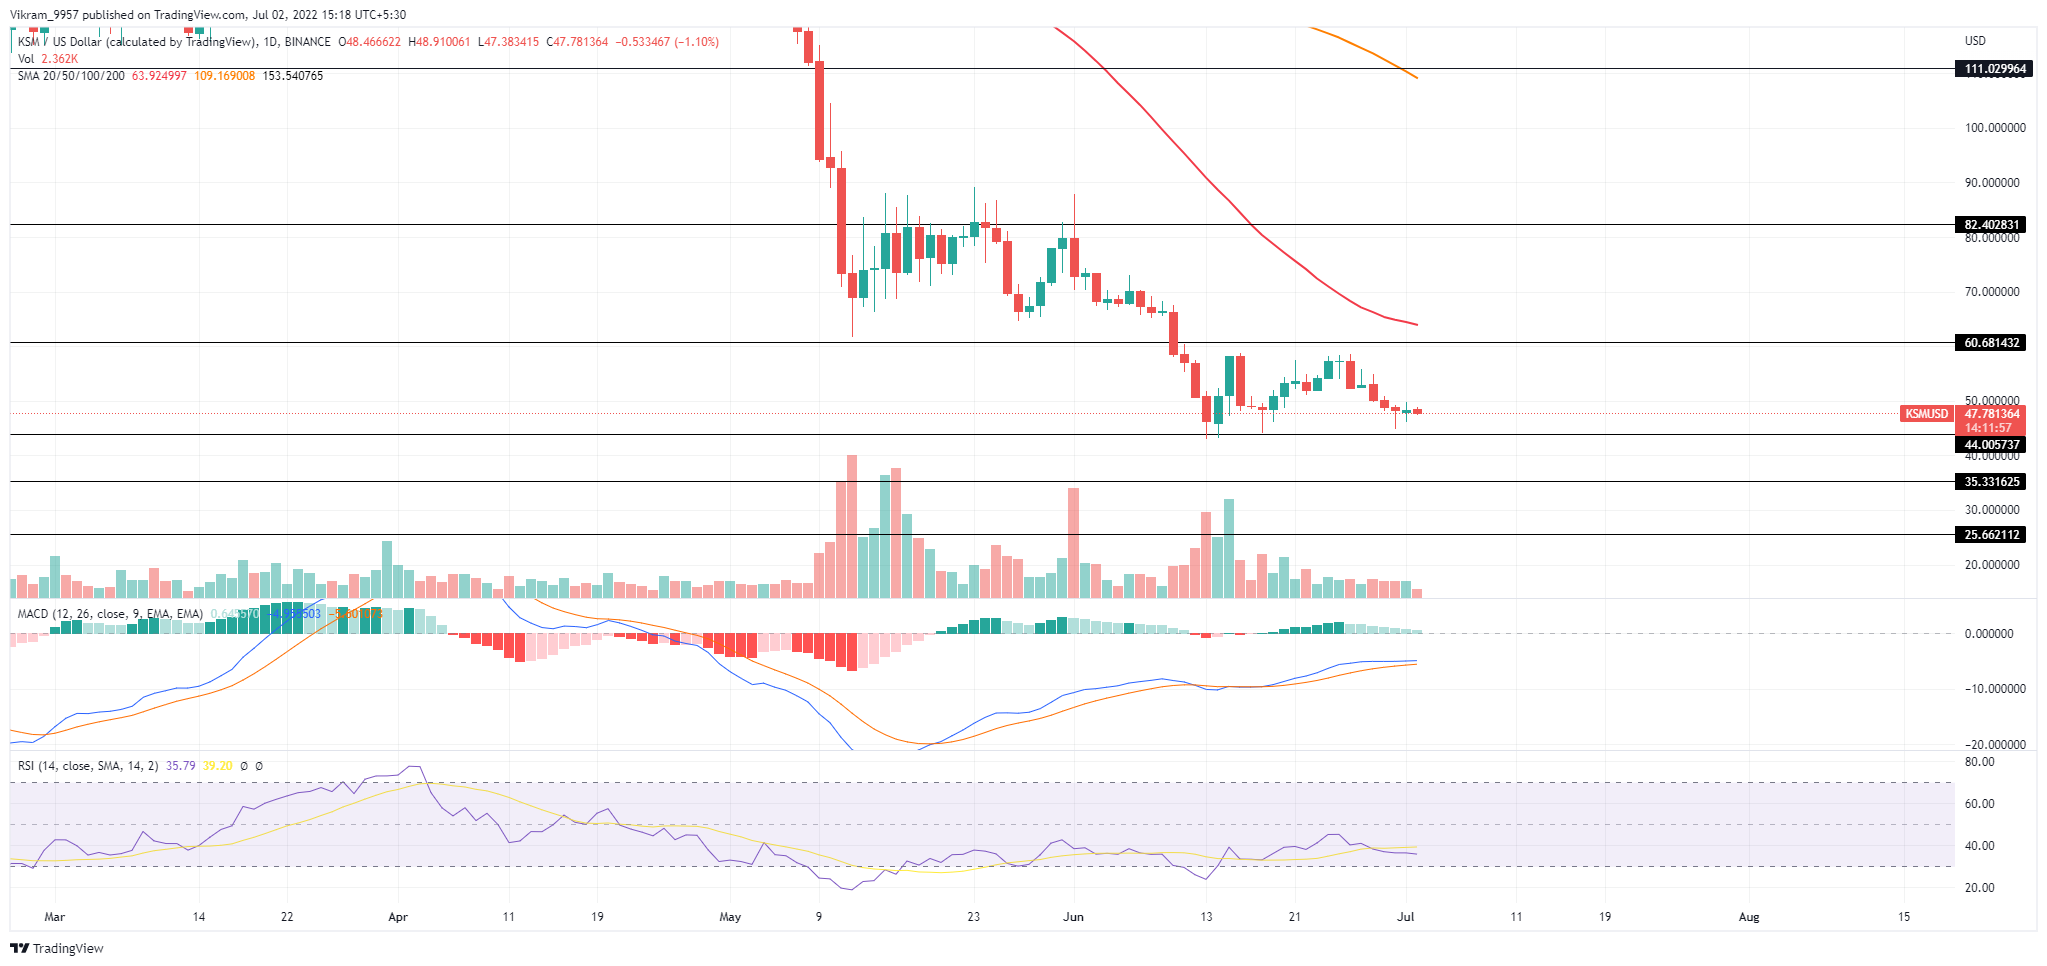 Source- Tradingview
KSM Technical Analysis
KSM price sustains above the $40 mark with the help of increased lower price reflection candles and increases the chances of a morning star pattern. Hence, traders can expect a reversal rally reaching the 50-day SMA. The MACD and signal lines showcase a failing bullish trend ready for a bearish crossover as the distance between the lines decreases. Moreover, the falling trend in the bullish histograms prepares the start of negative histograms denoting the bearish trend. The RSI indicator shows the slope falling under the 14-day SMA in the nearly oversold zone indicating a rise in the underlying bullishness. Hence, the indicator showcases a remarkable growth in underlying bearish sentiments. In a nutshell, the KSM technical analysis showcases the technical indicators going against the price action.
Upcoming Trend
Traders hoping for a bullish reversal in the KSM prices must wait for a price action confirmation with a morning star pattern formation. Traders can expect the reversal rally to reach the overhead resistance at the 50-day SMA. Resistance Levels: $50 and $60 Support Levels: $44 and $35