Recently Solana price analysis shows that the prices have surged upwards and are currently trading near the $33.06 level. Strong support is formed near this level, and the prices will likely continue to increase in the coming days. On the other hand, the SOL prices have also faced resistance at the $34.26 level, and the prices may consolidate soon before resuming their uptrend.
The SOL prices surged higher in the past few days and are currently trading near the $33.06 level. The prices found strong support at the $25 level and are now facing resistance at the $34.26 level. Recently, a bearish divergence formed on the 4-hour timeframe indicates that the bulls might be losing momentum.
Solana price movement in the last 24 hours: SOL/USD forms a bullish engulfing pattern
Solana price analysis daily chart rose 1.69 percent in a day. Prices have been declining to support and then rebounding over the last 24 hours, with a lot of activity throughout the market. Today’s high was $33.36, and the low was $32.06. The market is presently facing resistance at $35.
The moving averages show a bullish trend, with the 50-day MA crossing above the 200-day MA. This is a strong indicator of an uptrend in prices. The RSI is near the overbought levels, indicating that the prices might consolidate soon before resuming its uptrend. Overall, the short-term and medium-term trend for SOL/USD is bullish.
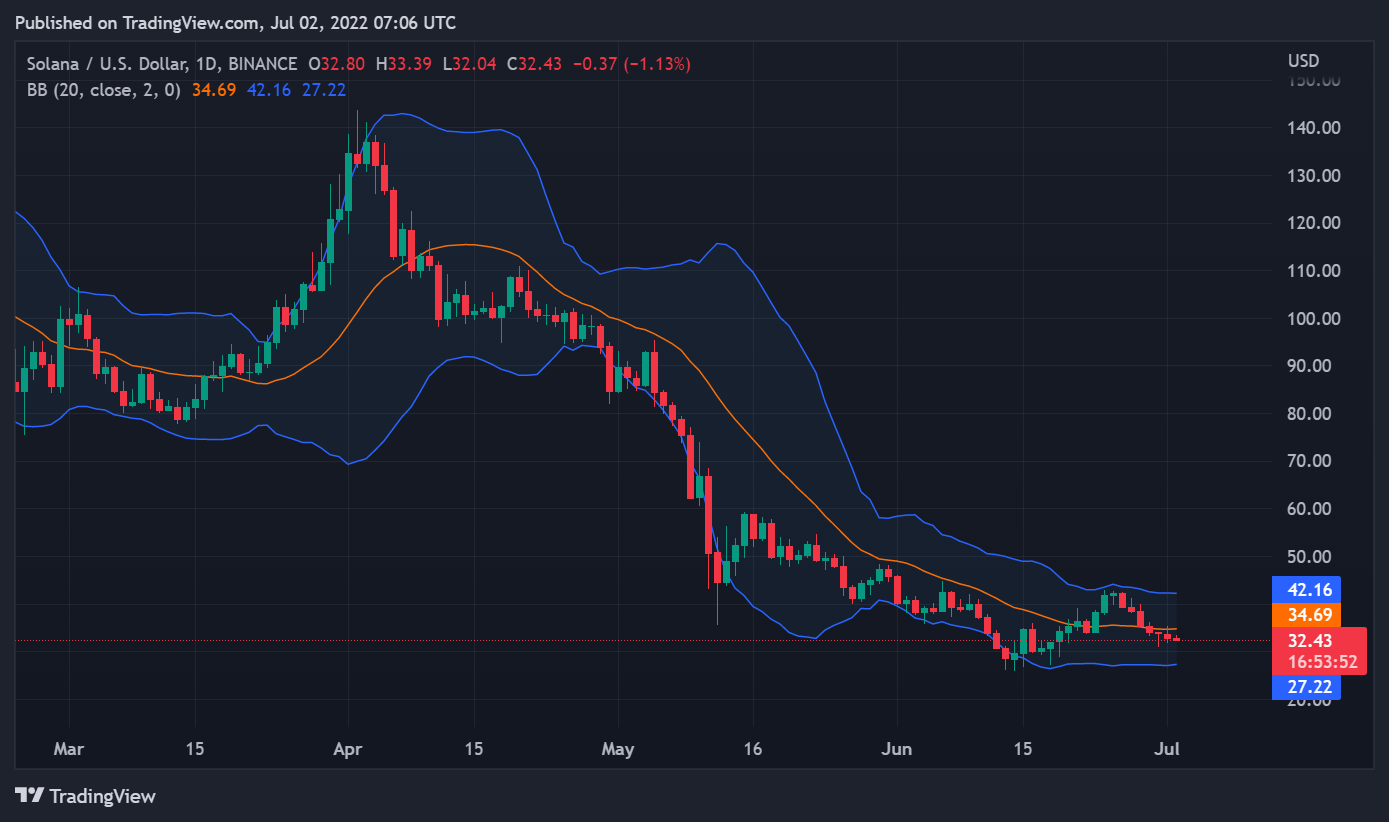
The market is currently supported by the $25 level and faces resistance at the $34.26 level. Recently, a bearish divergence was seen in the 4-hour timeframe, indicating that the bulls might be losing momentum. The SOL prices surged higher in the past few days and are currently trading near the $33.06 level.
A bullish engulfing pattern indicates that the MACD line is about to crossover the signal line to the upside, which is a positive signal. The RSI is presently at 57.89, suggesting that the market is neither overbought nor undersold. The EMA 50 is currently higher than the EMA 200, implying more buying activity than selling, and the market is in an uptrend. The Parabolic SAR indicator is placed below the prices, suggesting that the bulls are in market control.
Solana price analysis on the 4-hour price chart: Recent price developments
On the Solana price chart, we can see that the prices have retraced their highs after taking a break by the bulls. The bears have been attempting to push the prices lower, but thus far, the bulls have been able to defend $32.06.
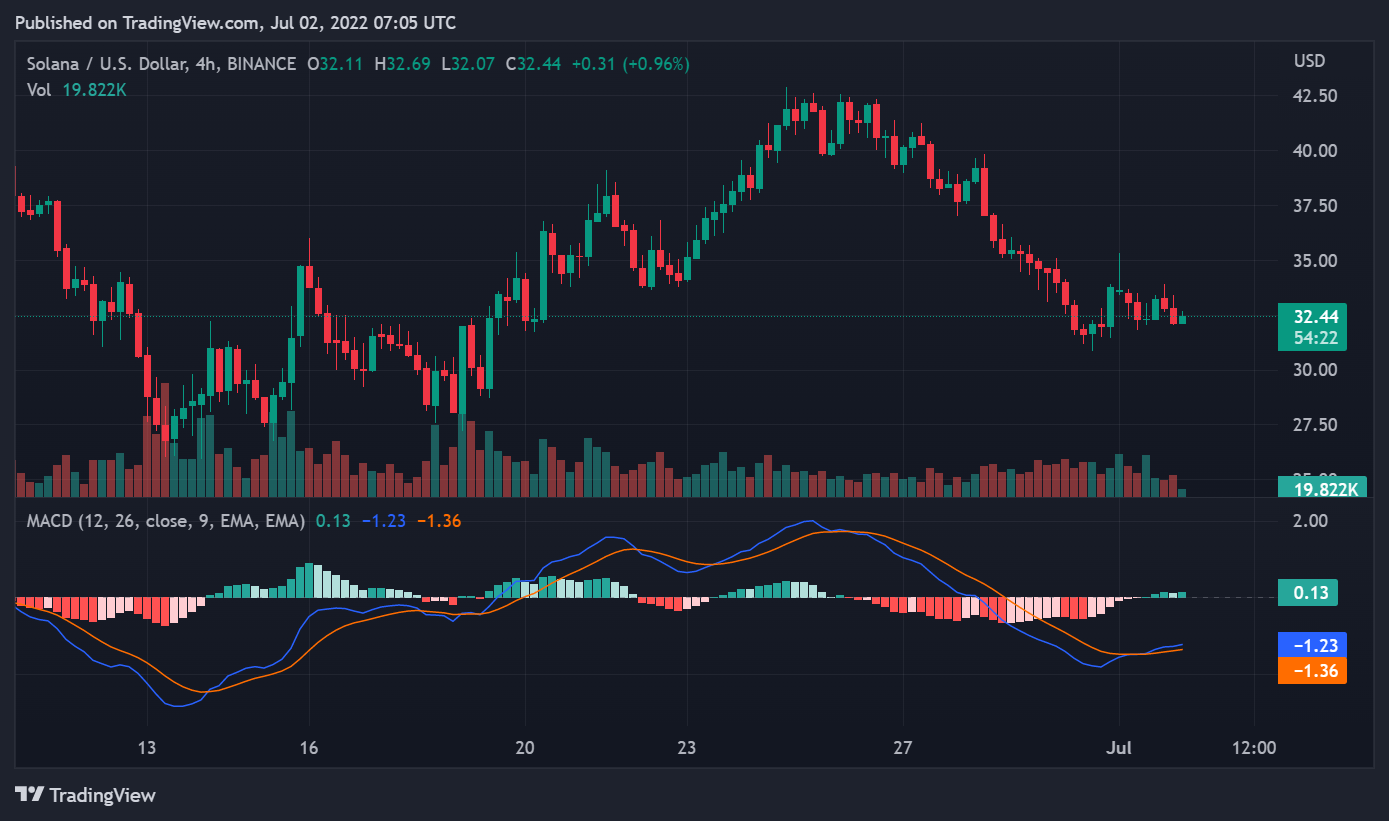
The bulls on the 4-hour chart suggest that the MACD line (blue) will soon crossover the signal line (red), which is a bullish indication. The market is currently supported by the $25 level and faces resistance at the $34.26 level. Recently, a bearish divergence was seen on the 4-hour timeframe, indicating that the bulls might be losing momentum.
Solana price analysis conclusion
Solana price analysis shows a strong upward trend. The SOL/USD pair’s prices provide optimism for a breakaway from a long-term downward trendline. Near $31.06, the market is also exhibiting buying support, which may lead to further price surges.
Disclaimer. The information provided is not trading advice. Cryptopolitan.com holds no liability for any investments made based on the information provided on this page. We strongly recommend independent research and/or consultation with a qualified professional before making any investment decisions.