- These waves of downtrend are bothering the investors. The bulls need to support the ecosystem before it collapses.
- The situation and the indicators suggest a bearish movement further for the IOTA.
- The IOTA/BTC pair is at 0.00001331 BTC with a loss of 1.56 in it.
IOTA is a distributed ledger with one big difference, it isn’t actually a blockchain. Instead, its proprietary technology is known as Tangle, a system of nodes that confirm transactions. In time IOTA’s goal is to become the De facto platform for executing transactions between IoT devices.
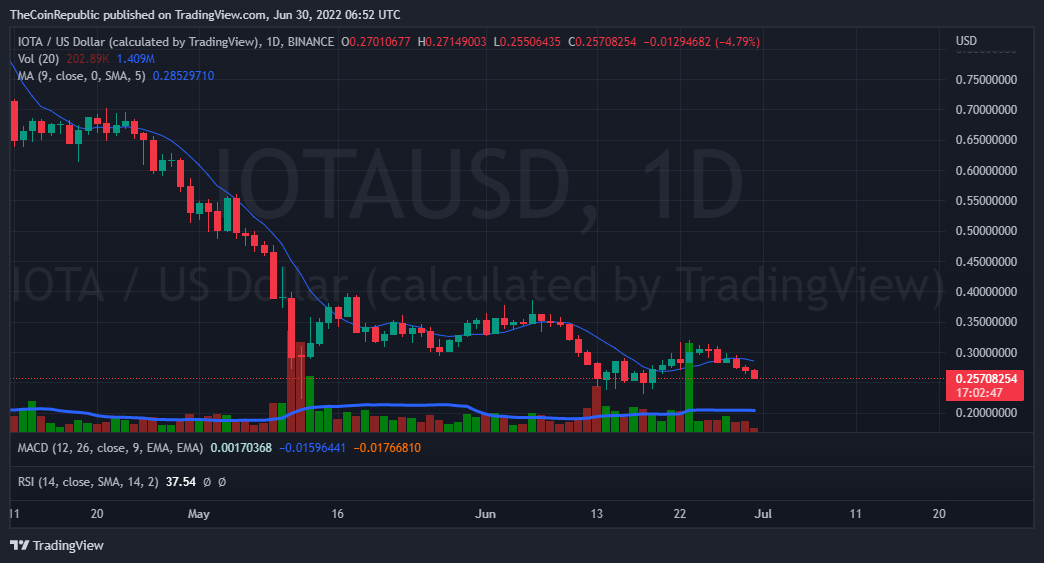
The waves of uptrend are now converted to that of downtrend by the bears on the daily chart. This bearish dominance is causing the price to fall continuously, bulls are trying to support but this bearish dominance is giving no chance to the MIOTA for a recovery. The coin needs to attract buyers in order to overcome this bearish dominance and to reverse the trend. The IOTA price is moving significantly low below the 5 days simple moving average and same with the trading volume.
The current price for one IOTA coin is moving at $0.25 with a loss of 4.44% in its market capitalization in the last 24 hrs. The coin has a trading volume of 10 million which is at a gain of 2.42% in the 23 hrs trading session and a market cap of 717 million. The volume market cap ratio for MIOTA is 0.01389.
What do Technical Indicators Suggest for IOTA?
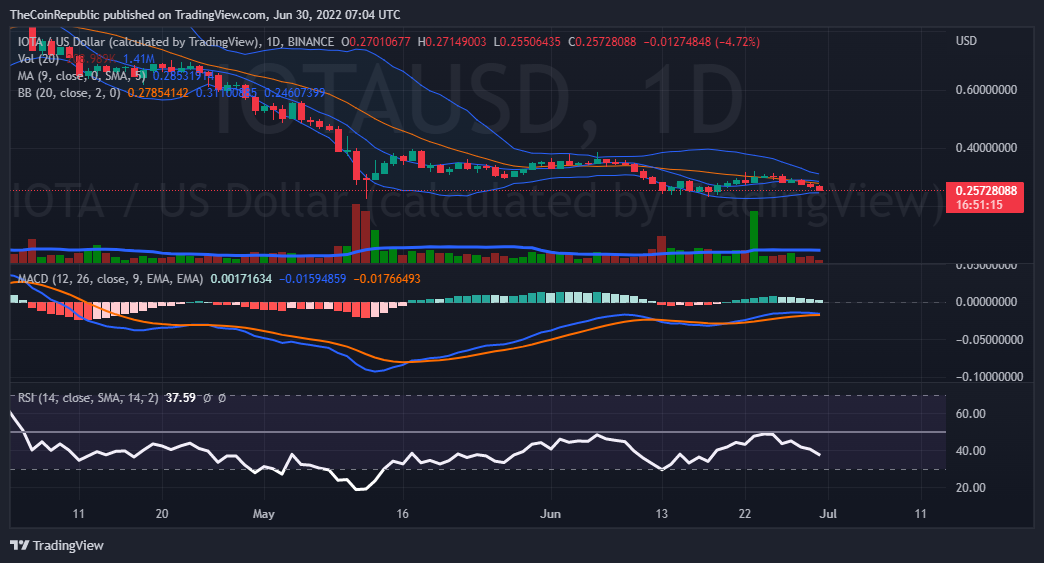
The trading volume is moving below its average still with a gain of 2.4%. The Bollinger band cloud is moving neutrally at present.
The MACD indicator indicates a bearish rally as a negative cross has just taken place and now the MACD line will move below the MACD signal line which indicates the sellers are dominating over the buyers, along with this the histograms are shrinking and fading in support of the crossover. The relative strength index is making a dive amid the selling pressure over the daily chart, the coin here needs its buyers to sustain in the market. The RSI value is below 40 and if the situation continues the RSI may soon indicate an oversold here.
Conclusion
The waves of uptrend are now converted to that of downtrend by the bears on the daily and hourly chart. The coin needs to attract buyers in order to overcome this bearish dominance and to make a trend reversal. Whereas the technical indicators are in favor of a bearish rally ahead. The investors need to take care of that.
Technical levels
Resistance levels: $0.28 and $0.30.
Support levels: $0.23 and $0.20
Disclaimer
The views and opinions stated by the author, or any people named in this article, are for informational ideas only, and they do not establish the financial, investment, or other advice. Investing in or trading crypto assets comes with a risk of financial loss.
ALSO READ: Top 10 NFT Collections You Should Know About in 2022