Avalanche price analysis shows that the market is bearish in the short-term time frame. The AVAX/USD pair is currently trading at $16.04 and is facing resistance at $18.21, however, a break above this level could see AVAX/USD target the $20 mark. On the downside, support for AVAX/USD is present at $15.87, and a break below this level could see the pair target the $13 mark. The market took a sharp turn lower over the past few hours as bears managed to push the price below the $17 mark.
The digital asset is currently range-bound between the $15 and $18 levels and is likely to remain so for the next few hours. The 24-hour trading volume has seen a slight increase over the past few hours and is currently at $468,468,649. The total market capitalization of the asset is currently at $4,632,364,276, which is slightly higher than its previous close.
Avalanche price analysis on a 24-hour price chart: Bears in control as prices dip below key support levels
The daily Avalanche price analysis is bearish as prices have dipped below key support levels. The AVAX/USD pair is trading at $16.04 and is facing resistance around the $18.21 level, which is likely to act as a hurdle for further upside in the market. The market opened at $17.37 and has seen a consistent sell-off over the past few hours as bears managed to push prices below the $17 level.
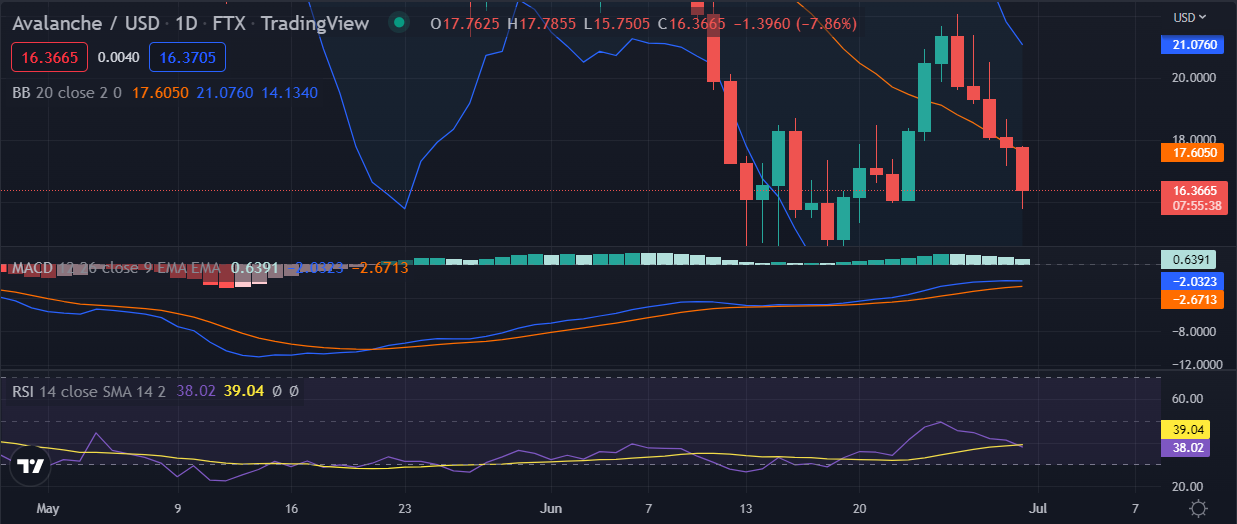
The upper limit of the Bollinger bands is at $17.87, which is well above the current market price, indicating that prices could continue to fall in the short term. The RSI indicator is currently at 36 and is showing no signs of a bullish reversal, indicating that the market could remain bearish for the next few hours. The MACD indicator (blue line) is currently well below the signal line (red line), indicating that prices could continue to fall in the short term.
Avalanche price analysis: Recent developments and further technical indications
The four hours Avalanche price analysis shows the support has appeared at $15.87 after a small bearish correction. The market was following an ascending trend line for the last 4 hours, but the recent downward correction has broken this ascending trend line. The price has dropped significantly as the bears are gaining control over the market.
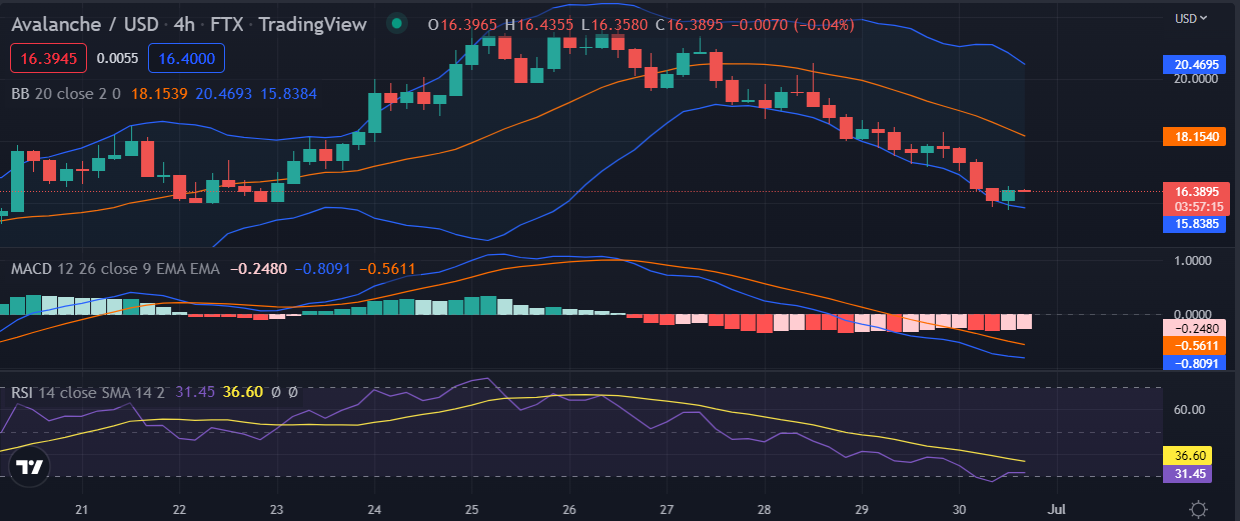
The four-hour technical indicators are currently pointing to a bearish market as the MACD indicator is indicating a strong bearish move, and the RSI indicator is currently well below the 50 levels. The Bollinger bands are currently close to each other, which is a sign of low market volatility. Therefore, we can expect the market to remain bearish over the next few hours as it could target the $15 support level.
Avalanche price analysis conclusion
Avalanche price analysis is bearish in the short term as the market has slipped below the $20 level. The market may test the $15.87 level in the near term if the bears mount further pressure. Price analysis of Avalanche shows that AVAX/USD is currently in a bearish trend as it slides to $18.21. The technical indicator analysis is also bearish in the short term as all indicators are pointing towards a further downside.
Disclaimer. The information provided is not trading advice. Cryptopolitan.com holds no liability for any investments made based on the information provided on this page. We strongly recommend independent research and/or consultation with a qualified professional before making any investment decisions.