Polkadot price analysis continues to show bearish signs, as price recorded a 5 percent decline over the past 24 hours. The current decline has been in place since June 25, 2022, with price declining more than 10 percent since. DOT could move as low as the bottom support at $6 if the $6.65 level doesn’t hold. A further decline down to $5.45 could also be expected with bearish action continuing to dominate. DOT trading volume over the past 24 hours rose more than 24 percent, exhibiting seller dominance in the market.
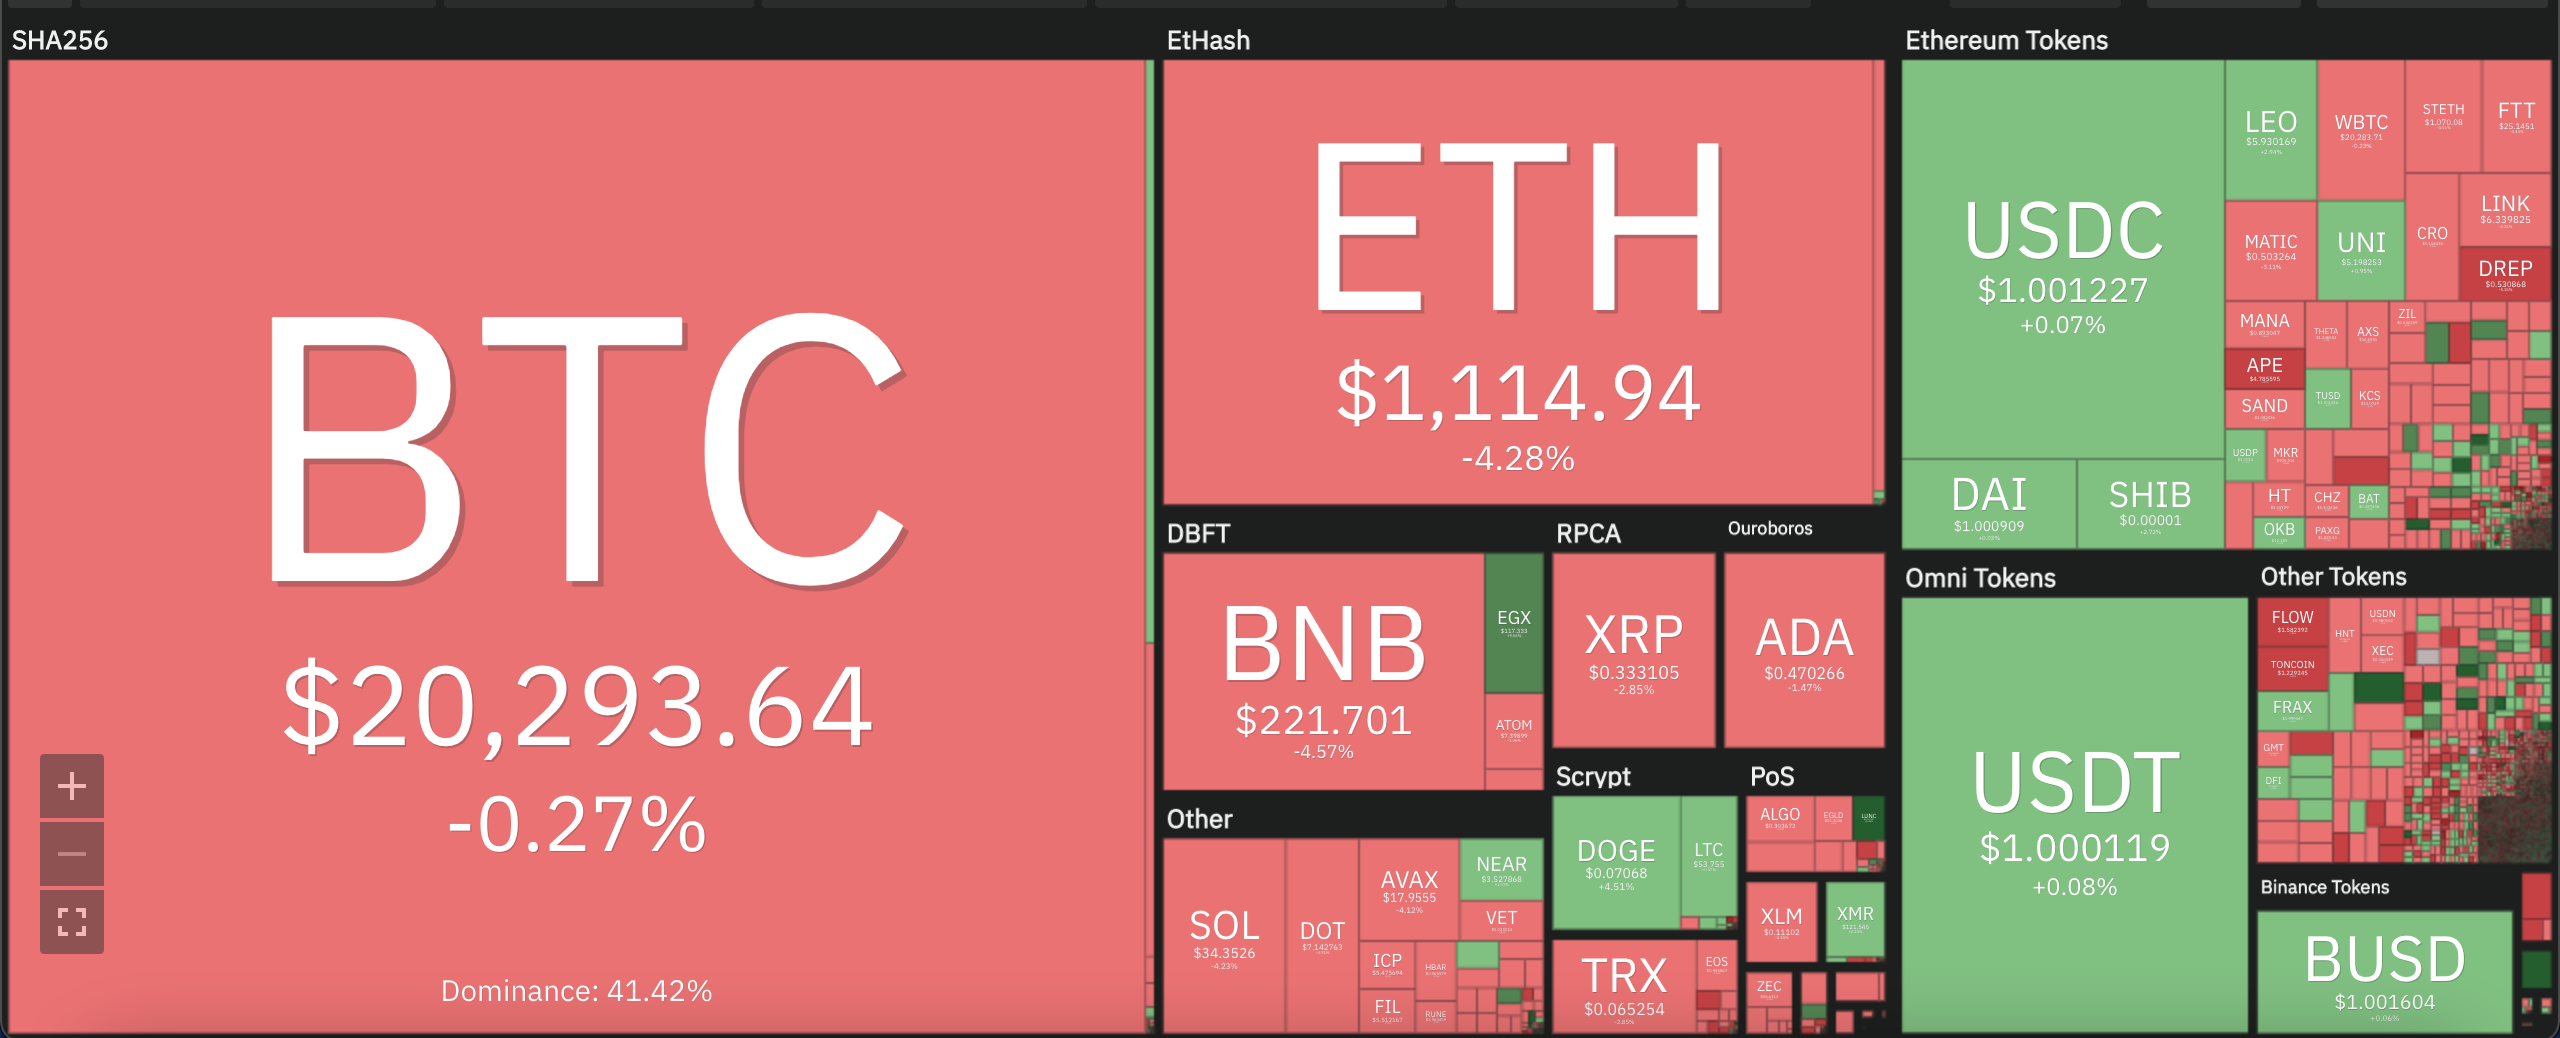
The larger cryptocurrency market continued to downtrend over the past 24 hours, led by Bitcoin’s decline down to the $20,000 mark. Ethereum dropped 4 percent to move down to $1,100, while leading Altcoins showed a similar trend. Cardano and Ripple dropped 1 and 2 percent each, respectively, whereas Solana recorded a 4 percent increment. Dogecoin, meanwhile formed a rare uptrend, with price rising 4 percent to move up to $0.07.
Polkadot price analysis: RSI falls down on daily chart leaving little sign of reversal
On the 24-hour candlestick chart for Polkadot price analysis, price can be seen continuing along an extended descending triangle with price falling as low as $7.06 during the day’s trade. Polkadot’s resurgence on June 15, 2022 has been met with a significant spell on the sidelines. In this period, price has generally pivoted around the $7.45 mark, which has also come under threat over the current downtrend.
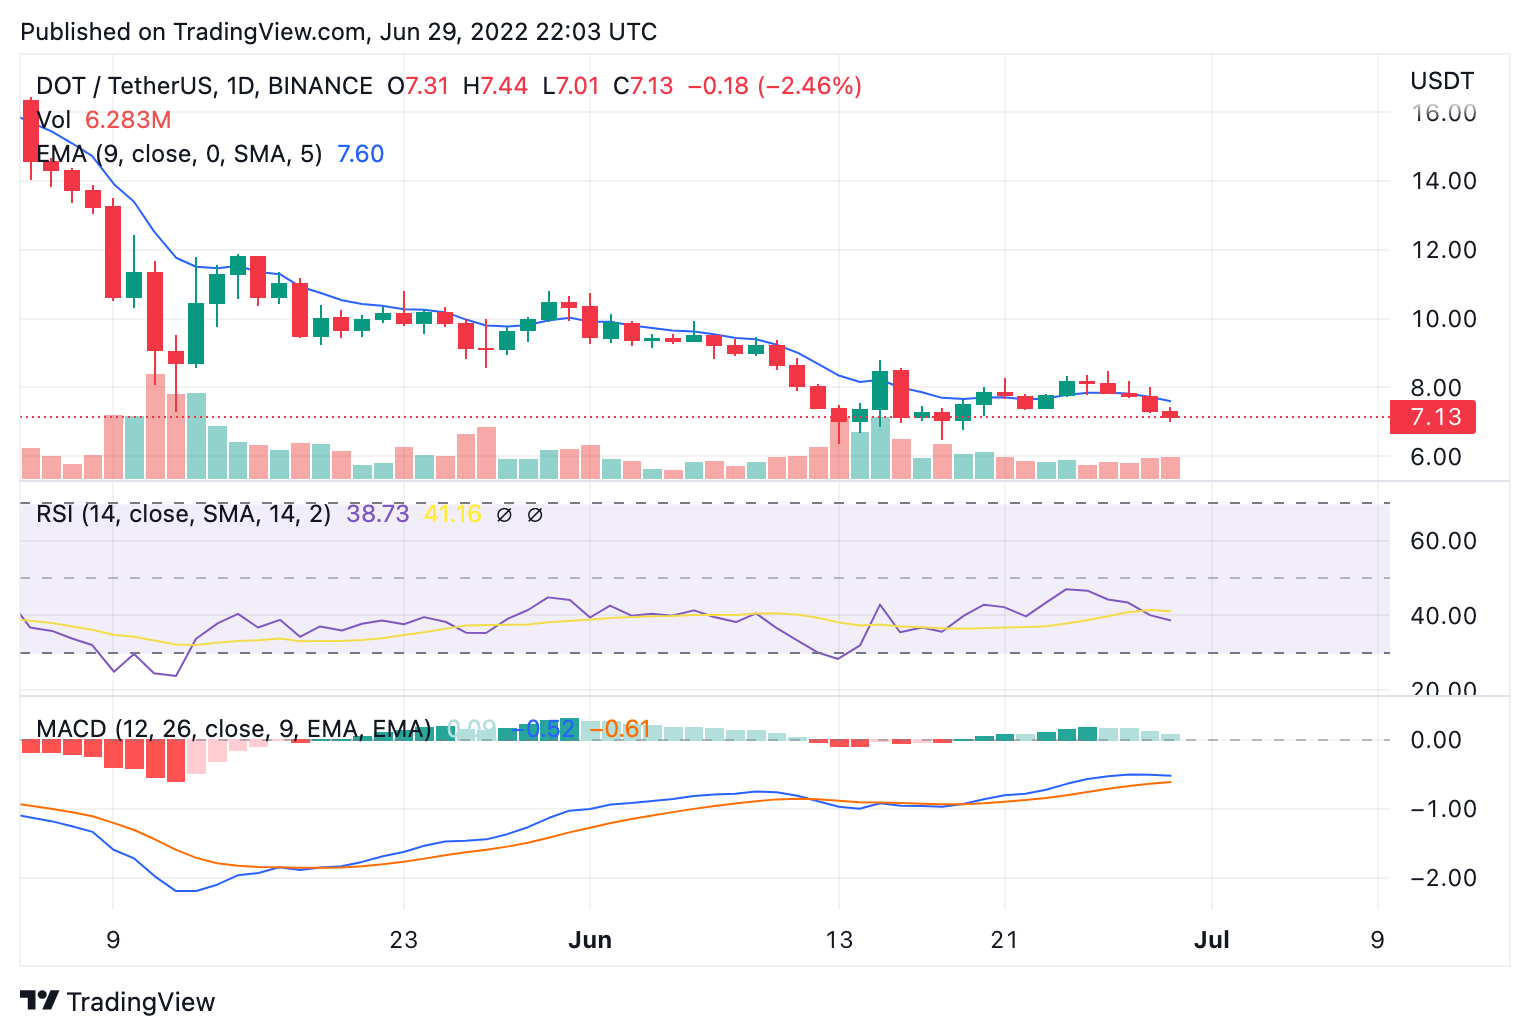
The 24-hour relative strength index (RSI) shows further bearish signs with devaluating market at 38.55. With trading volume rising more than 24 percent, the majority action is selling. Price dropped further below the 50-day exponential moving average (EMA) at $7.69, whereas the moving average convergence divergence (MACD) curve continues to form lower lows above the neutral zone.
Disclaimer. The information provided is not trading advice. Cryptopolitan.com holds no liability for any investments made based on the information provided on this page. We strongly recommend independent research and/or consultation with a qualified professional before making any investment decisions.