After the bulls pushed the price by 34% from the lowest mark in June, they retreated after reaching the first resistance zone. Ripple has spent the previous four days in red and has lost about 13% of its value as of this writing.
Technical Analysis
By Grizzly
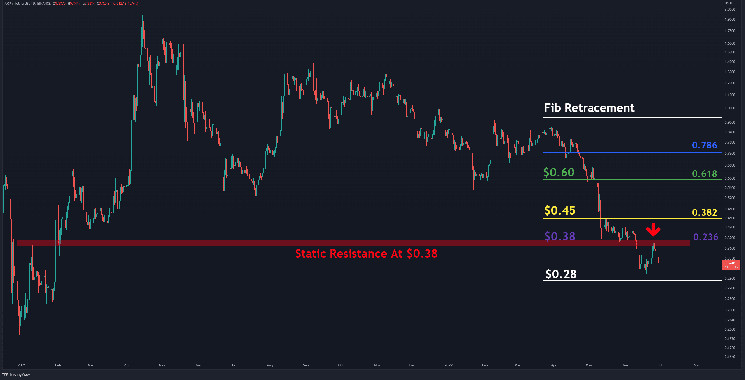
The Daily Chart
On the daily timeframe, the intersection of the Fibonacci level at 0.236 (in purple) with the horizontal resistance at $0.38 (in red) has formed a supply zone. Given the mentioned structure, if the bears fail to push the price below $0.3, forming a higher bottom, the recent move is more likely to constitute a short-term correction.
But if this correction gets stretched below $0.3, then the end of the short-term uptrend would be confirmed. Furthermore, the RSI 14d indicator, entering the bullish zone with a sharp movement, changed direction after reaching the baseline (in white) and is gaining momentum in the bearish zone.
On the other hand, if buyers can form a higher high above $0.38, then one can expect the recent downtrend, which started in early April, to have halted for the mid-term.
Key Support Levels: $0.30 & $0.24
Key Resistance Levels: $0.38 & $0.45
Moving Averages:
MA20: $0.33
MA50: $0.38
MA100: $0.55
MA200: $0.80
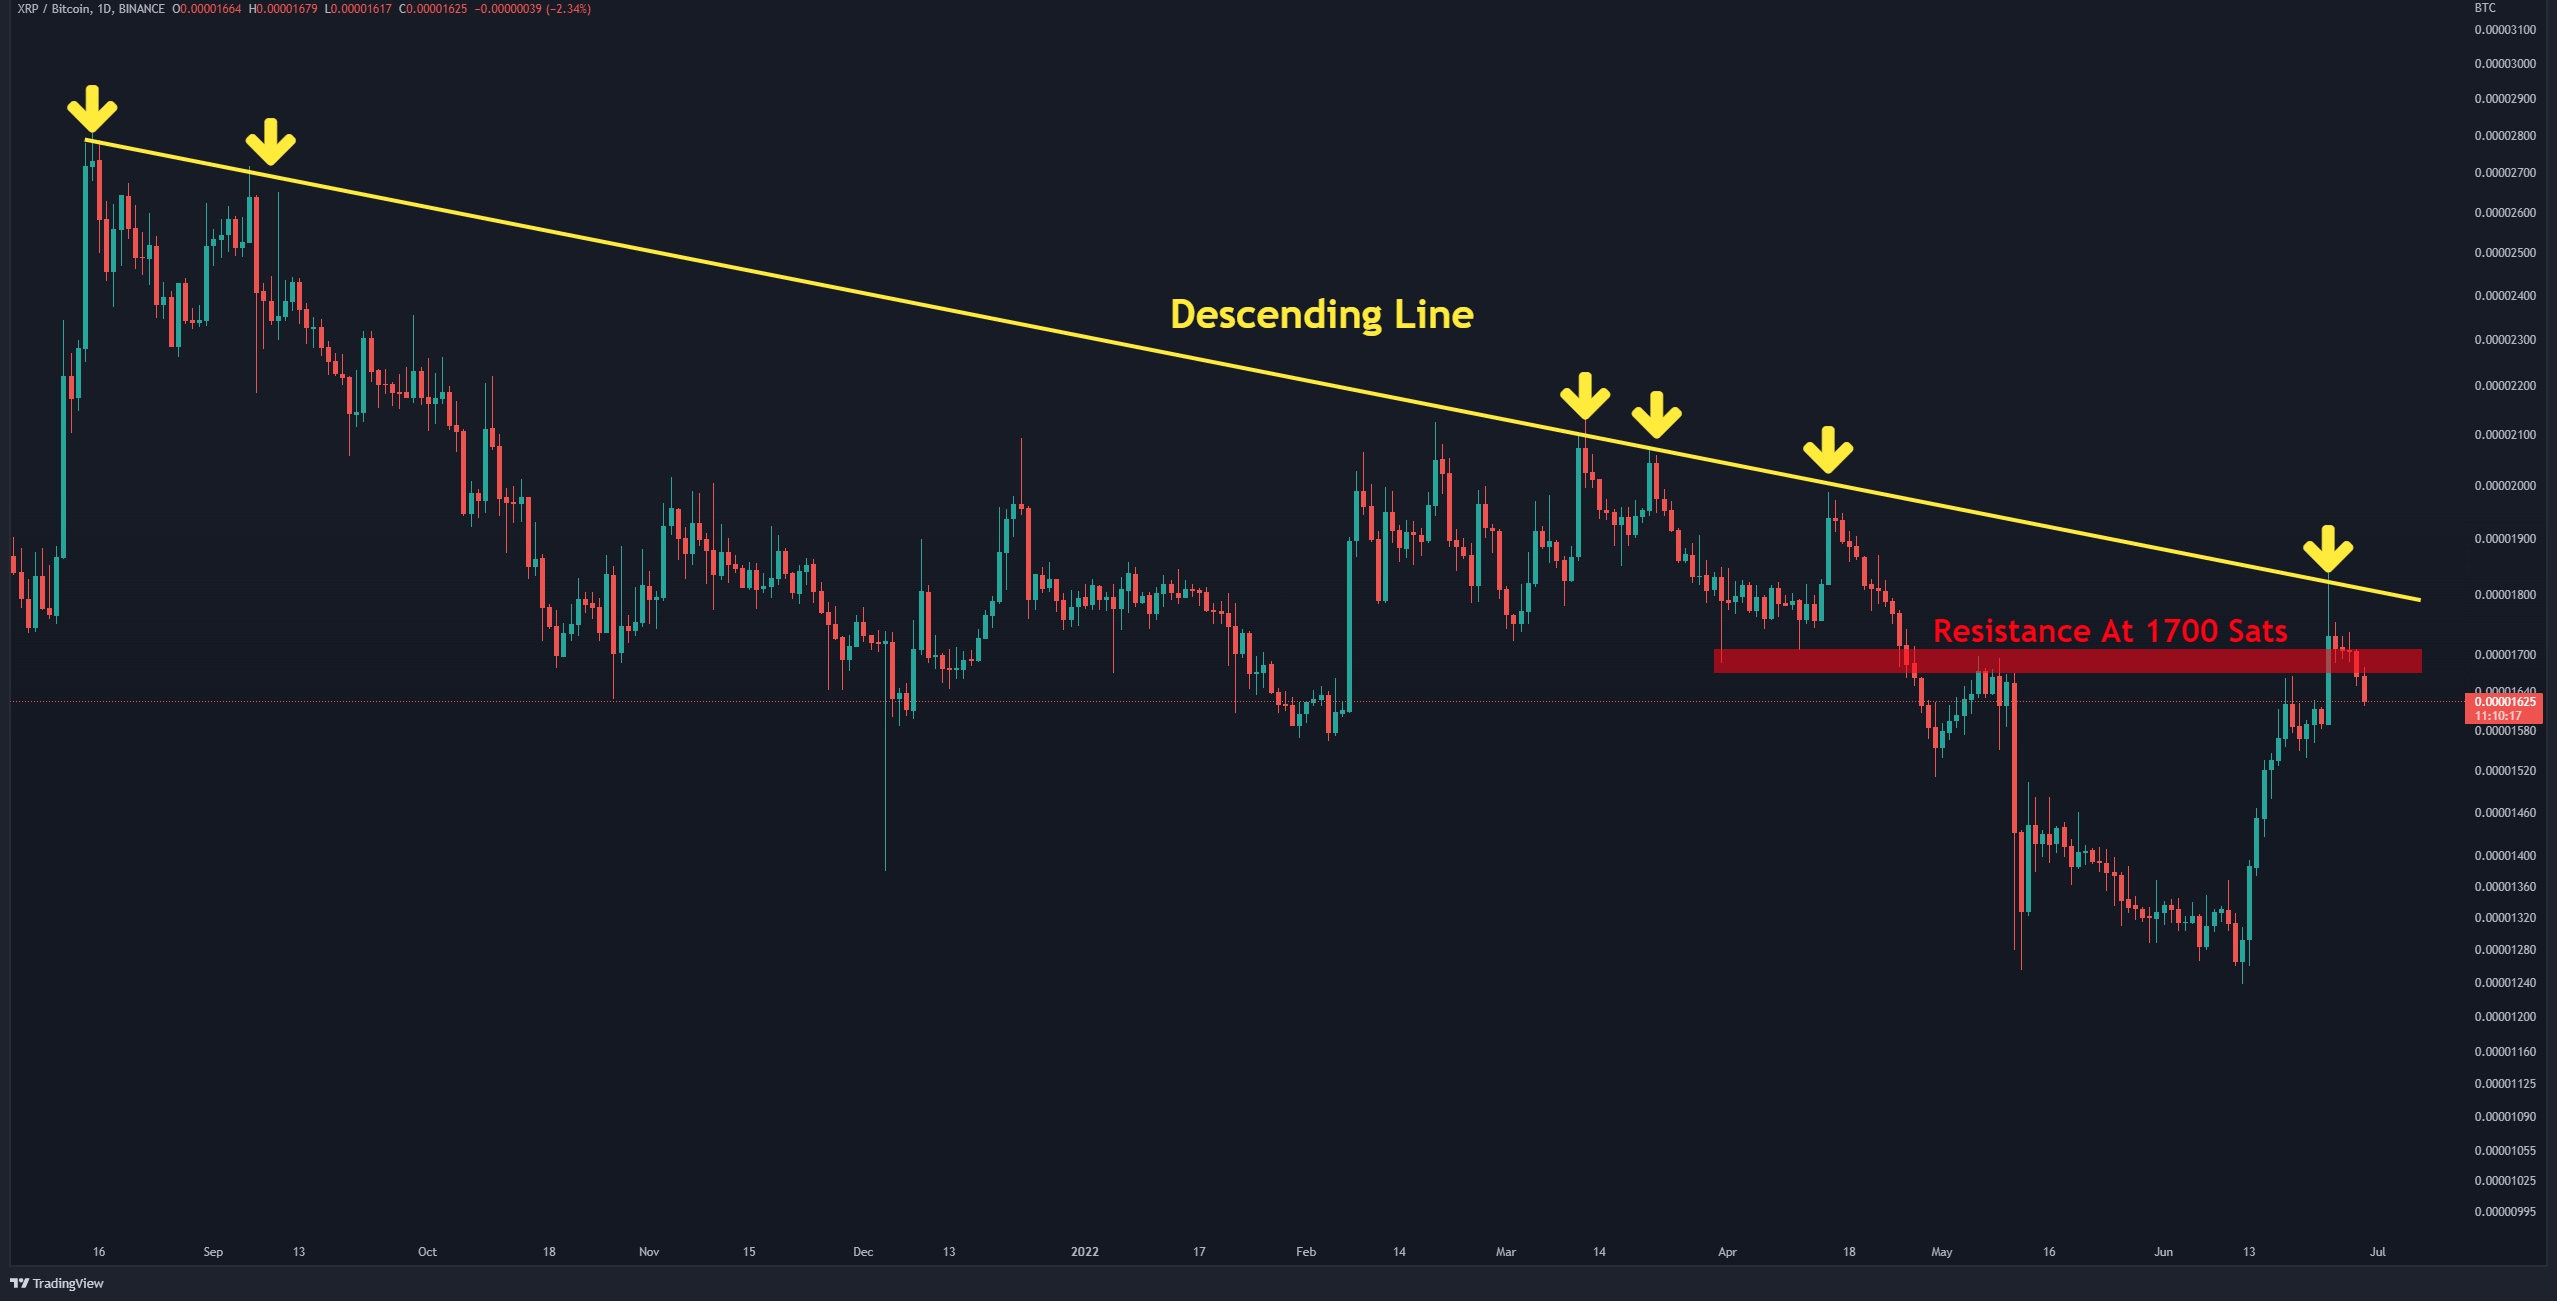
The XRP/BTC chart
Against Bitcoin, XRP did not continue to move up after reaching the descending line (in yellow). This reversal can be considered a fake breakout above the static level at 1700 Sats (in red). Due to the long upper shadow on June 24, the selling pressure is high in the 1700-1800 Sats range. If buyers manage to keep the price above the support at 1500 Sats, this move can be considered a healthy correction.
Key Support Levels: 1500 Sats & 1250 Sats
Key Resistance Levels: 1700 Sats & 1800 Sats