- Solana price has breached the 8-day simple moving average.
- SOL price has been rejected at a critical Relative Strength Index level.
- Invalidation of the bearish downtrend is a breach above $43.
Solana price shows early signs of a bearish downtrend underway. The invalidation level is a vital determinant of future price action.
Solana price shows weakness
Solana price shows exhaustion as the bulls have lost the battle for the $40 barrier. Since June 13, when lows were established at $25.86, the centralized smart contract token has managed to rally 65%. Now the unfolding selloff could become cataclysmic as the bears have breached the 8-day simple moving average (SMA), forcing early bulls to jump ship. The Relative Strength Index confounds a sneakily bearish move underway as the selloff occurred directly at the sellers’ 65 level.
Solana price next bullish support zones must hold, or the June 14 lows at $25.86 could be disastrously breached. A breach of the low could induce a bearish frenzy with targets in the $10 vicinity. A Fibonacci rejection tool surrounding the June 13 low and recent June 24 high of $42.94 shows the 61.8% retracement level at the $31 price level. Traders should consider this as the final bullish support zone. A close below $31 will fuel bearish confidence and an influx of bearish breakout traders into the market to target the June 13 swing low.
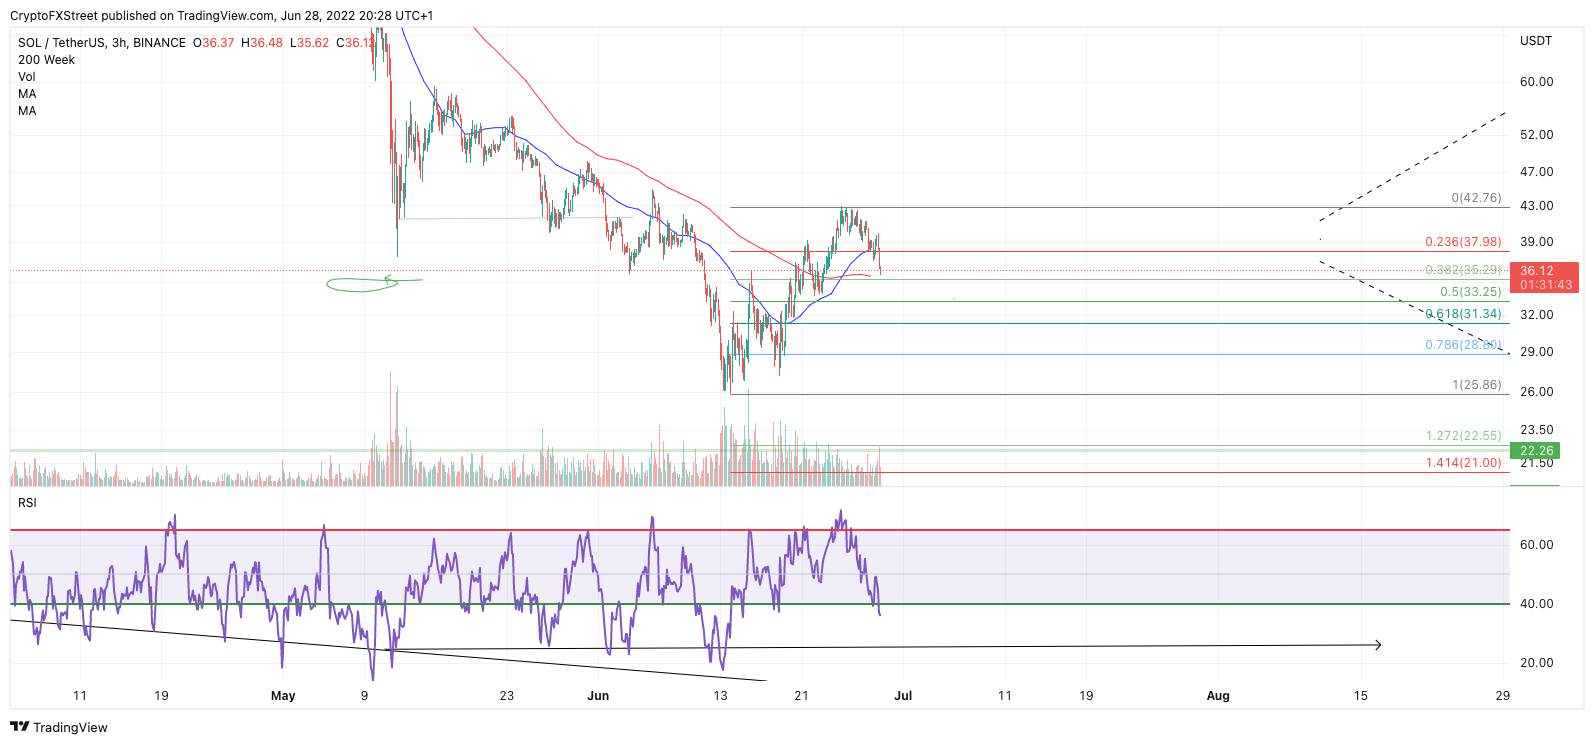
SOL/USDT 3-Hour Chart
Invalidation of the bearish downtrend is a breach above $43. If the bulls can conquer this level, they may be able to propel into the $50 price zone, resulting in a 40% increase from the current Solana price.