- Polkadot price is still in a significant downtrend unless $16.42 is touched. One more decline is possible to create the fifth wave down.
- The volume profile shows bullish re-entrance into the market while bitcoin has been signaling multiple market bottom indicators.
- Invalidation of this downtrend idea is a breach above wave A at $11.47.
Polkadot price could print one more decline into $4. Bitcoin, however, shows bullish evidence; thus, a pullback scenario is likely.
Polkadot price may go up, sideways, then back down.
Polkadot price, like many cryptos in the market, shows signals of a temporary bottom. Still, this thesis is written more as a warning of certain levels and a potential forecast on how the next move might play out.
Polkadot price declining structure may pull back but not exceed the $11.47 mark if these technicals are correct. Since its first decline on January 20, 2022, the DOT Price produced a very common zigzag structure as a wave two retracement. The current pullback warrants the idea that a wave four triangle may be underway as a rule of Elliot Wave alternation. The Volume Profile indicator confounds the idea of a brief relief rally as bulls are visibly re-entering the market. Bitcoin has also shown reasons to believe that a local bottom is near.
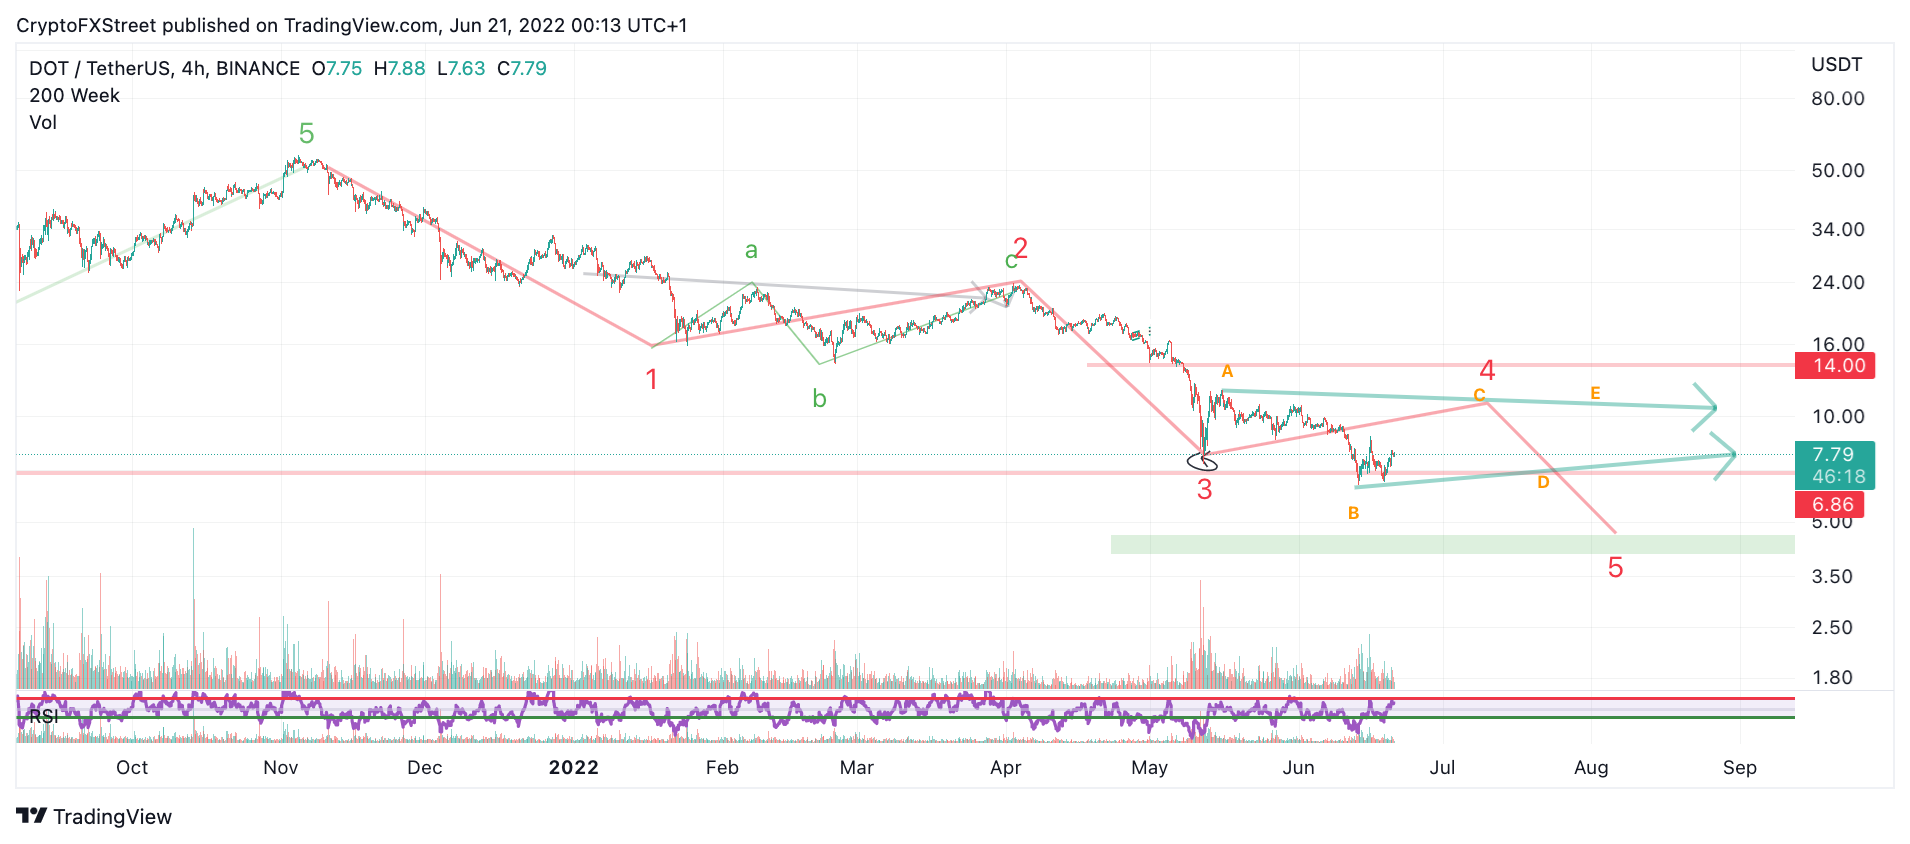
DOT/USDT 4-Hour Chart
A breach above $16.42 can invalidate the macro downtrend. However, traders looking to play the range can use wave A at $11.47 as a bearish invalidation and potentially short the DOT price in the coming weeks if the opportunity presents itself. If 11.47 were to get breached, the bulls could rally as high as $15, resulting in a 102% increase from the current DOT price.