Polkadot (DOT) is attempting to hold on above a long-term support area at $19.
There are currently no bullish reversal signs in place. In addition, DOT has broken down from its short-term pattern, further adding to the bearish sentiment.
Polkadot attempts to hold on above support
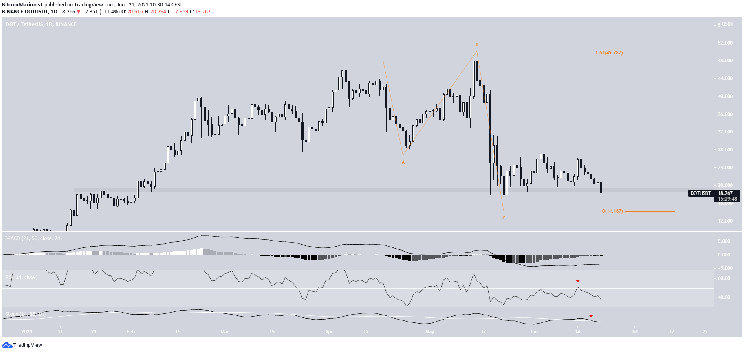
DOT has been moving downwards since May 15 when it reached an all-time high price of $49.78.
The decrease continued until a local low of $13.73 was reached on May 23.
The price rebounded shortly after, reclaiming the $19 support area. However, it has decreased to it once again and could break down.
Technical indicators are bearish. The MACD signal line is below 0, even though the histogram is showing strength. Furthermore, the RSI has been rejected by the 50-line and the Stochastic oscillator has made a bearish cross (red icon).
Despite this, the ongoing decrease looks like an A-B-C corrective structure, in which waves A:C have a 1:1.61 ratio.
So, it’s possible that this is not the beginning of a new bearish impulse. A look at lower time-frames is required in order to determine this.
Short-term movement
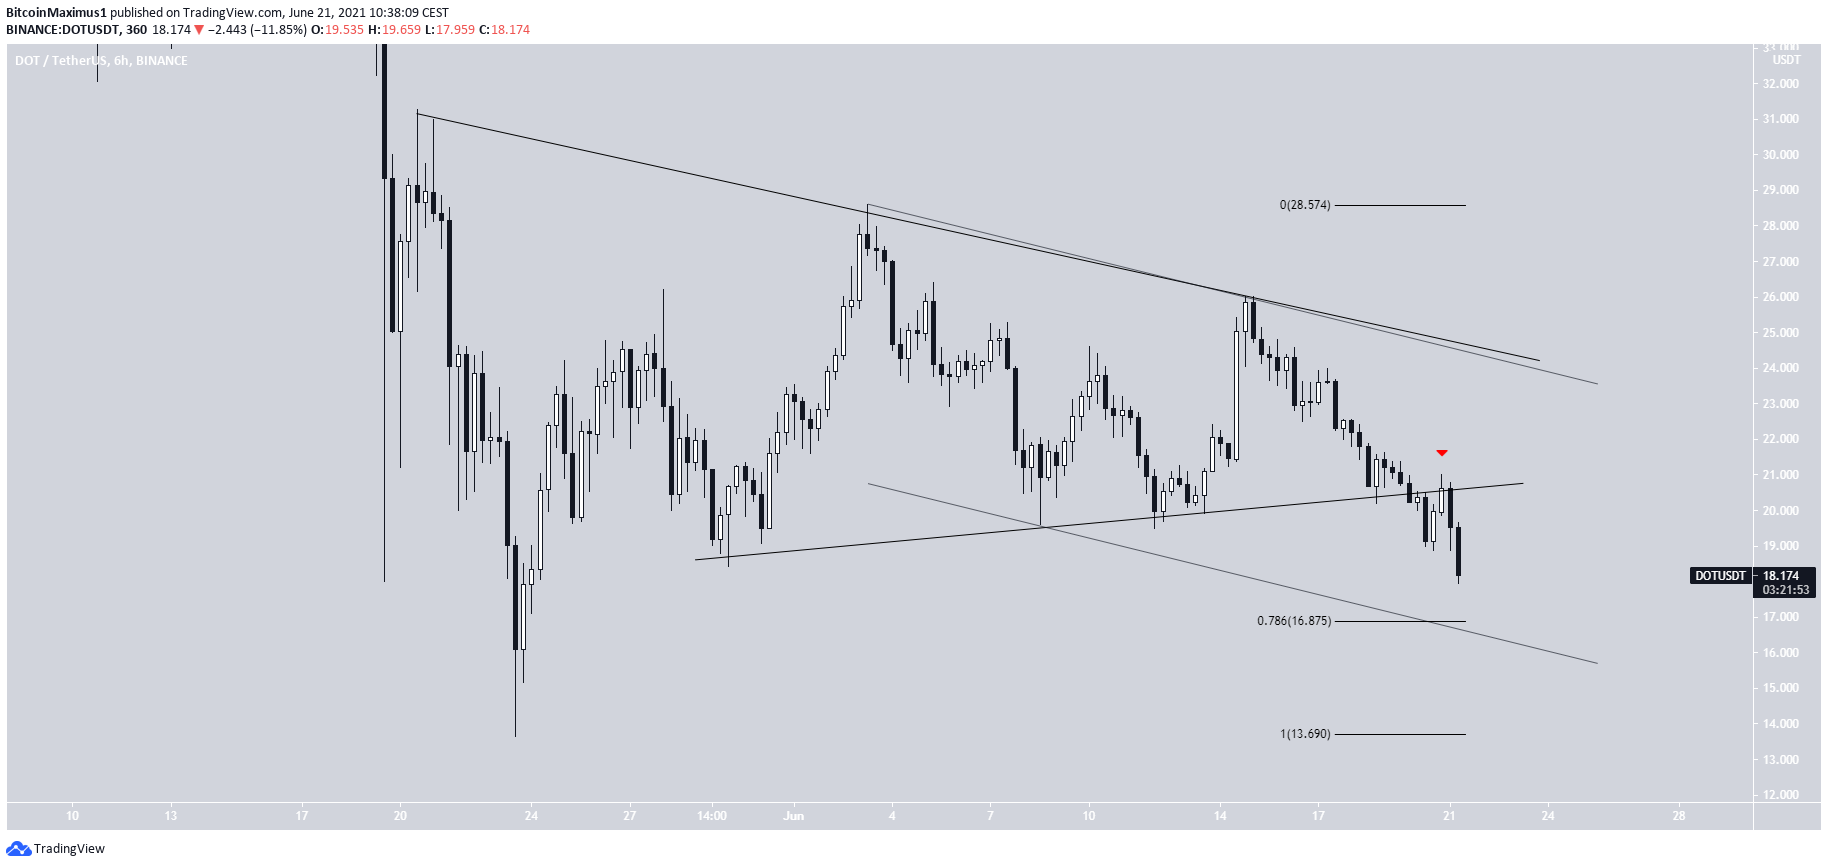
The six-hour chart shows that DOT has broken down from a symmetrical triangle and validated it as resistance after (red icon).
A potential support level is found at $16.87. This is the 0.786 Fib retracement support level and the support line of a descending channel.
If it doesn’t manage to find support at this level, it could decrease below the May 23 lows and fall towards $8.
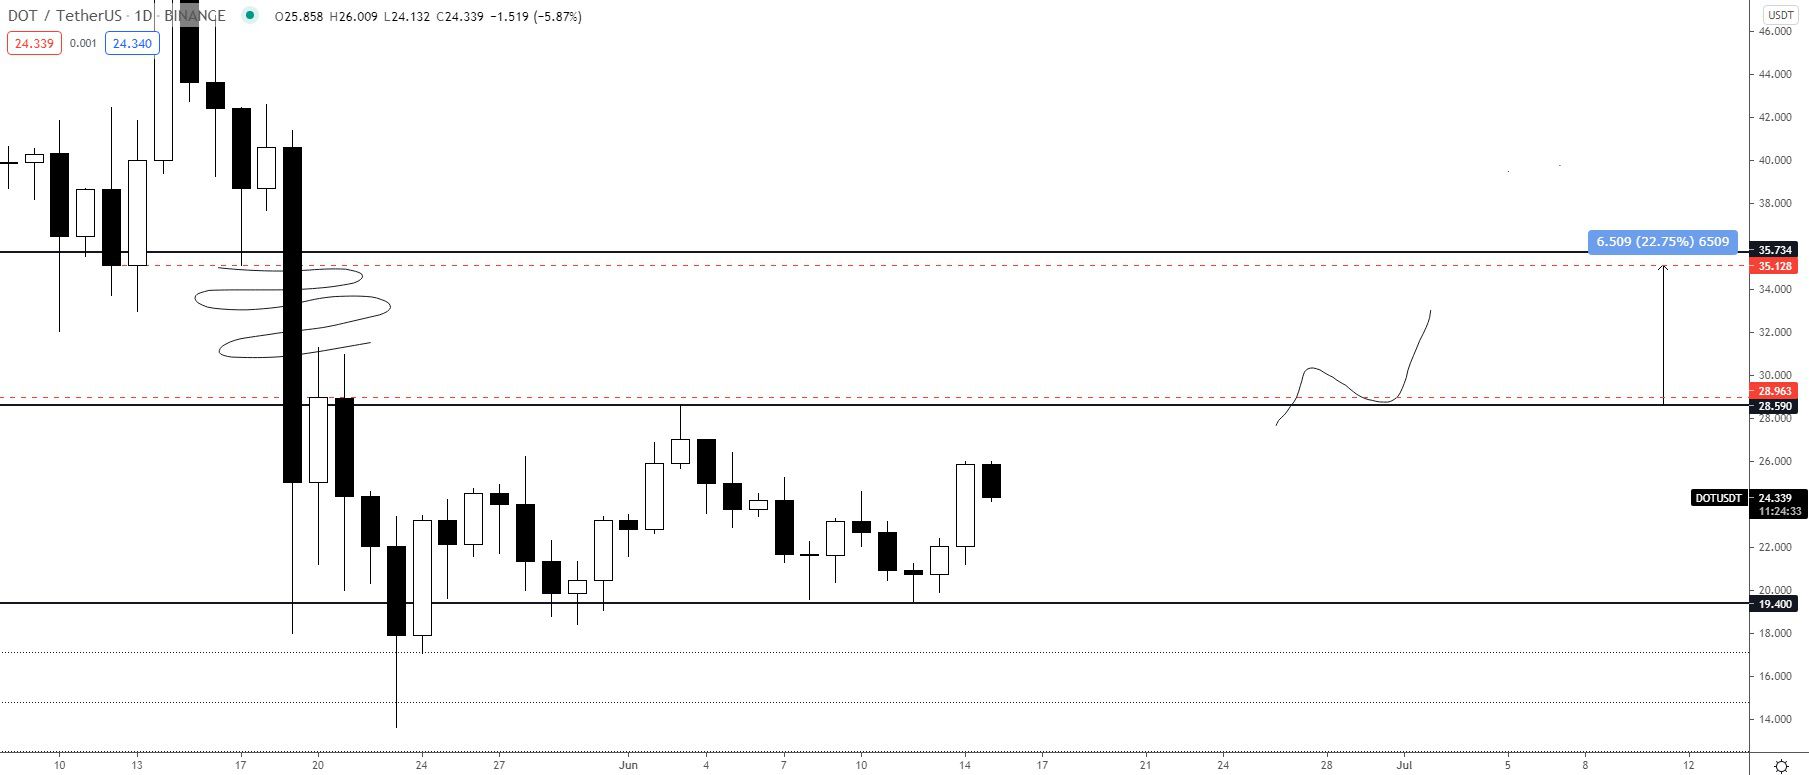
Cryptocurrency trader @TheEuroSniper outlined a DOT chart, stating that a daily close above $28 would be a bullish development. While the $28 area is a strong resistance level, due to the aforementioned breakdown, DOT is still far from reaching it.
DOT/BTC
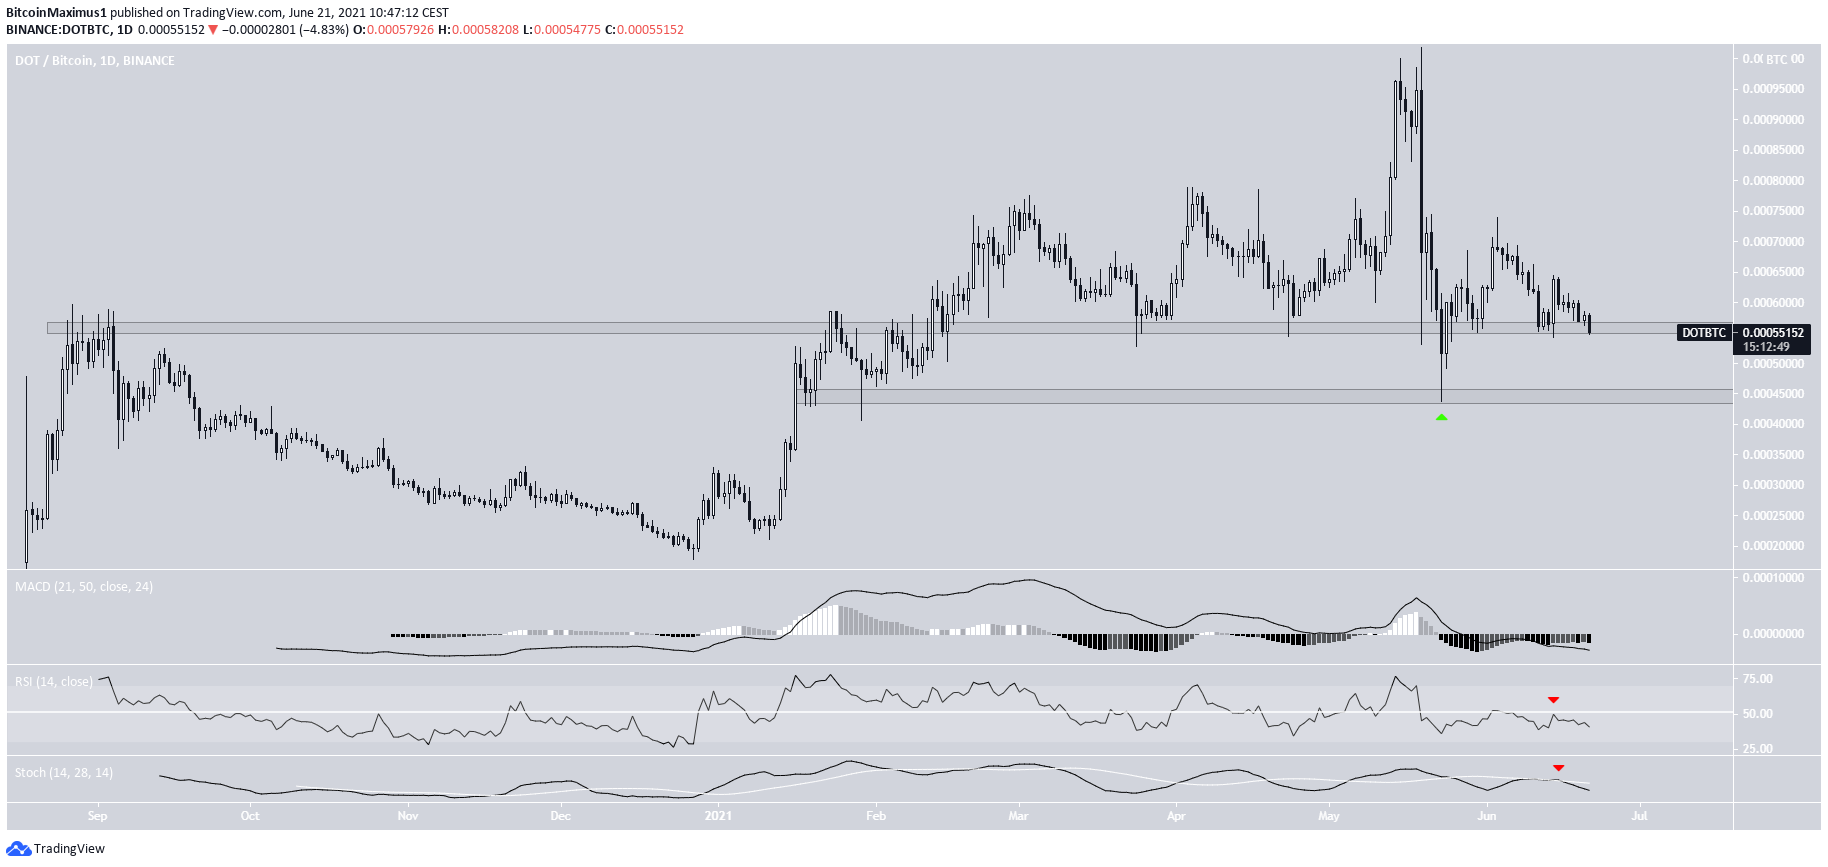
Similar to its USD counterpart, DOT/BTC is attempting to hold on above the 56,000 satoshi support level.
It bounced on May 23 and is now attempting to create a higher low. However, technical indicators in the daily time frame are bearish. This is especially evident by the RSI rejection from the 50-line and bearish cross in the Stochastic oscillator (red icons).
If DOT breaks down, the next closest support would likely be found at 44,000 satoshis.