The HNT cryptocurrency has been in a state of correction like most cryptocurrencies since November 2021. During this time, sellers have been able to lower the HNT price to the previous local lows in 2021. Interestingly, most cryptocurrencies have long since broken the lows of May-June 2021 and continue to fall successfully. However, in the case of the HNT cryptocurrency, we see a much more positive result. All sellers managed to do during the horrible weekly candle of 9 May was to create a false break of the important price zone of $8.9. As a result, during the 3 trading weeks, sellers did not stay below this range and took the initiative in the market. 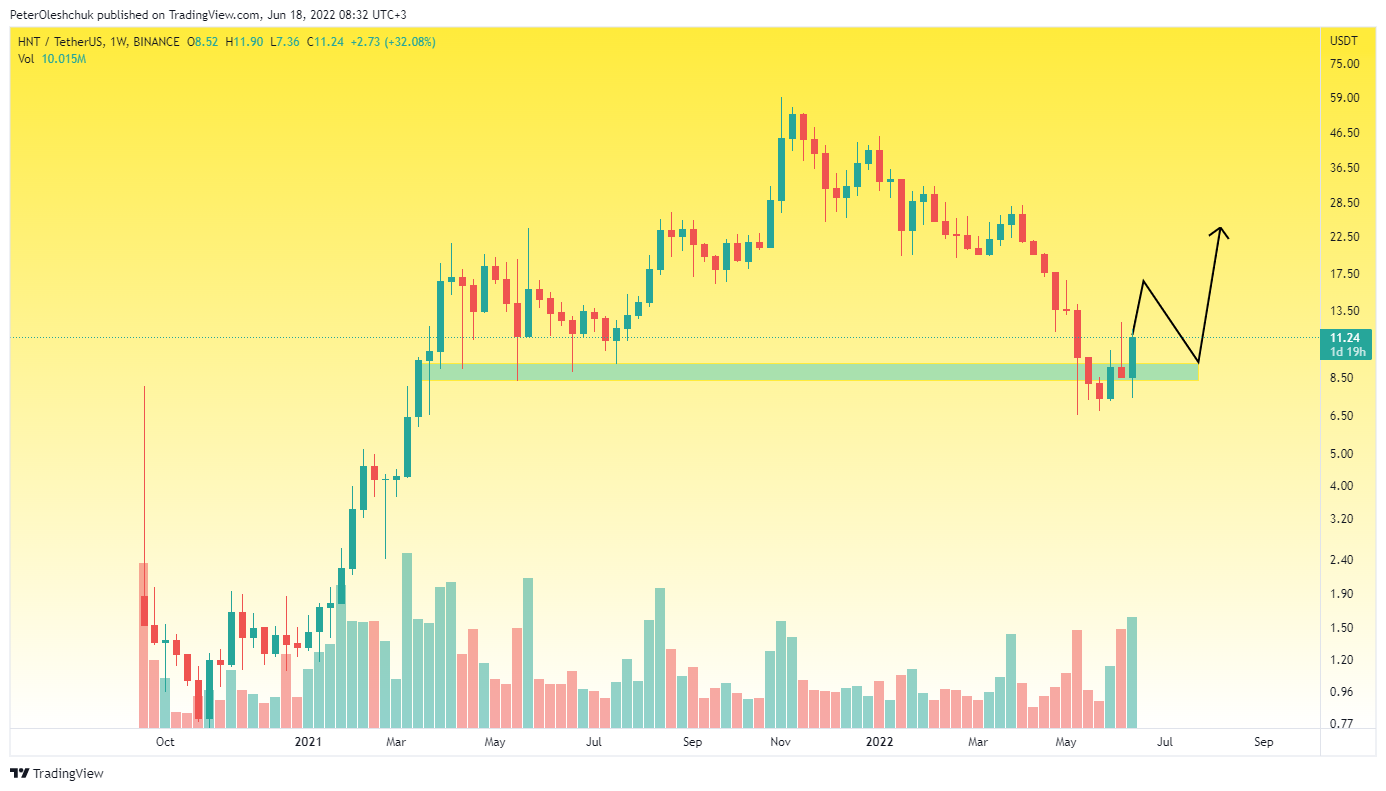 Source: https://www.tradingview.com/x/qN3Wf42G/ If you look at the weekly Bitcoin candle, you will see how fear and panic can be shown in the form of a candle. However, the HNT weekly candle of 13 June is the complete opposite. Despite the BTC fall, the HNT cryptocurrency has confidently grown by 30% in a week. Trading volumes continue to increase, which indicates the interest of investors in cryptocurrency in this price range. Therefore, while the $8.9 range is under the control of buyers, we will expect continued HNT growth with the final target of $23.
HNT Technical Analysis on The Daily Timeframe
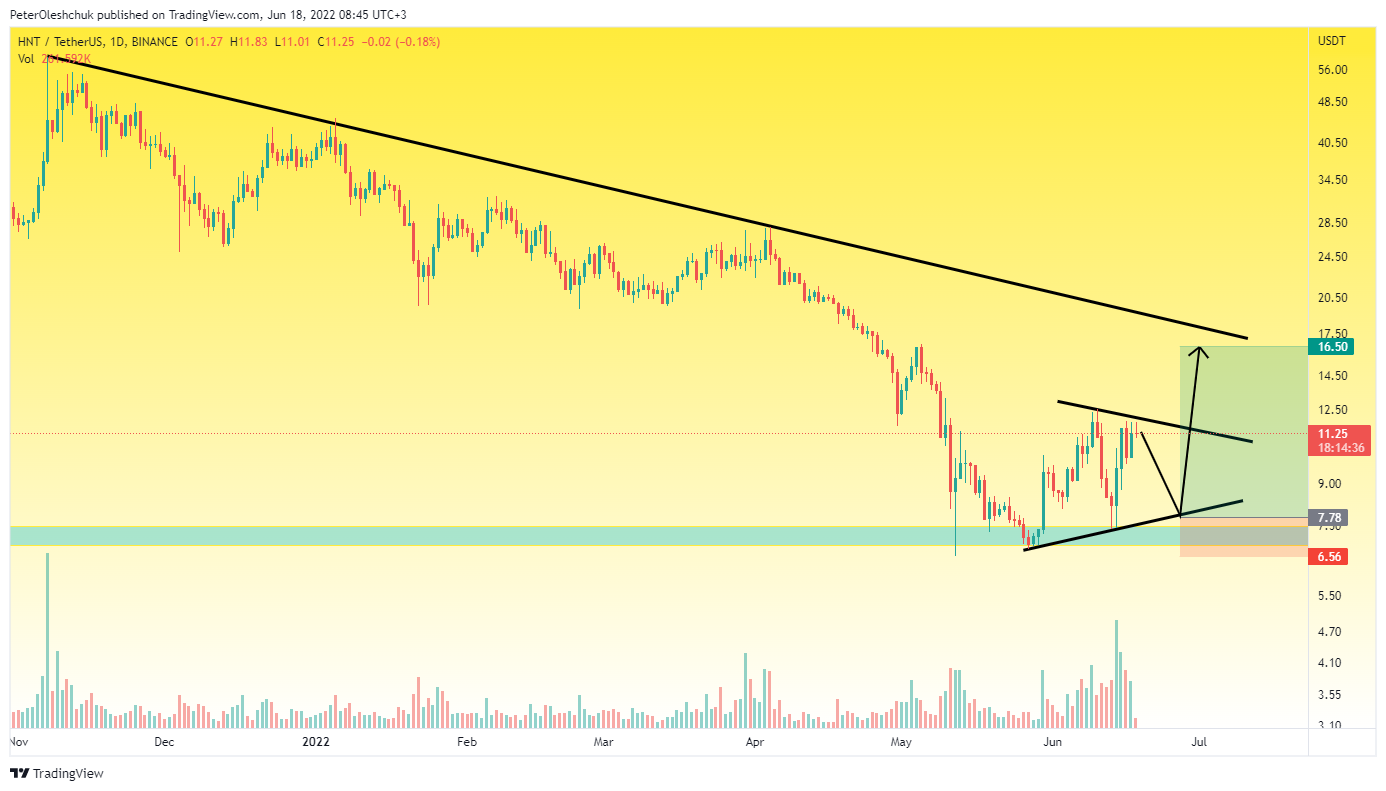 Source: https://www.tradingview.com/x/a77JddL9/ Analyzing the movement of the HNT price on the daily timeframe, you can see the probable formation of a triangle. This means that the continued growth of the HNT price without correction to the first mark of $16.5 is questionable. On the fourth day, buyers can not pass the local obstacle - $11.88. In addition, most recently, buyers have tried to take control of the mark of $11.88 and they also failed. Therefore, we expect a local HNT price fall to $8. Near this mark, there will be a good chance to buy HNT with the final target of $16.5. It is interesting to note that the trading volumes on the daily timeframe increased during the creation of the triangular consolidation. This fact indicates a change in the market initiative, the beginning of positions gaining, and a global HNT reversal. It is also possible to notice that the liquidity zone from where buyers started the reversal was concentrated below $8.9. The real range that was able to withstand a strong HNT fall wave is in the range of $7. Losing control of this mark will trigger an alternative scenario of $4 per HNT.
HNTBTC Price - Buyers Control The Market
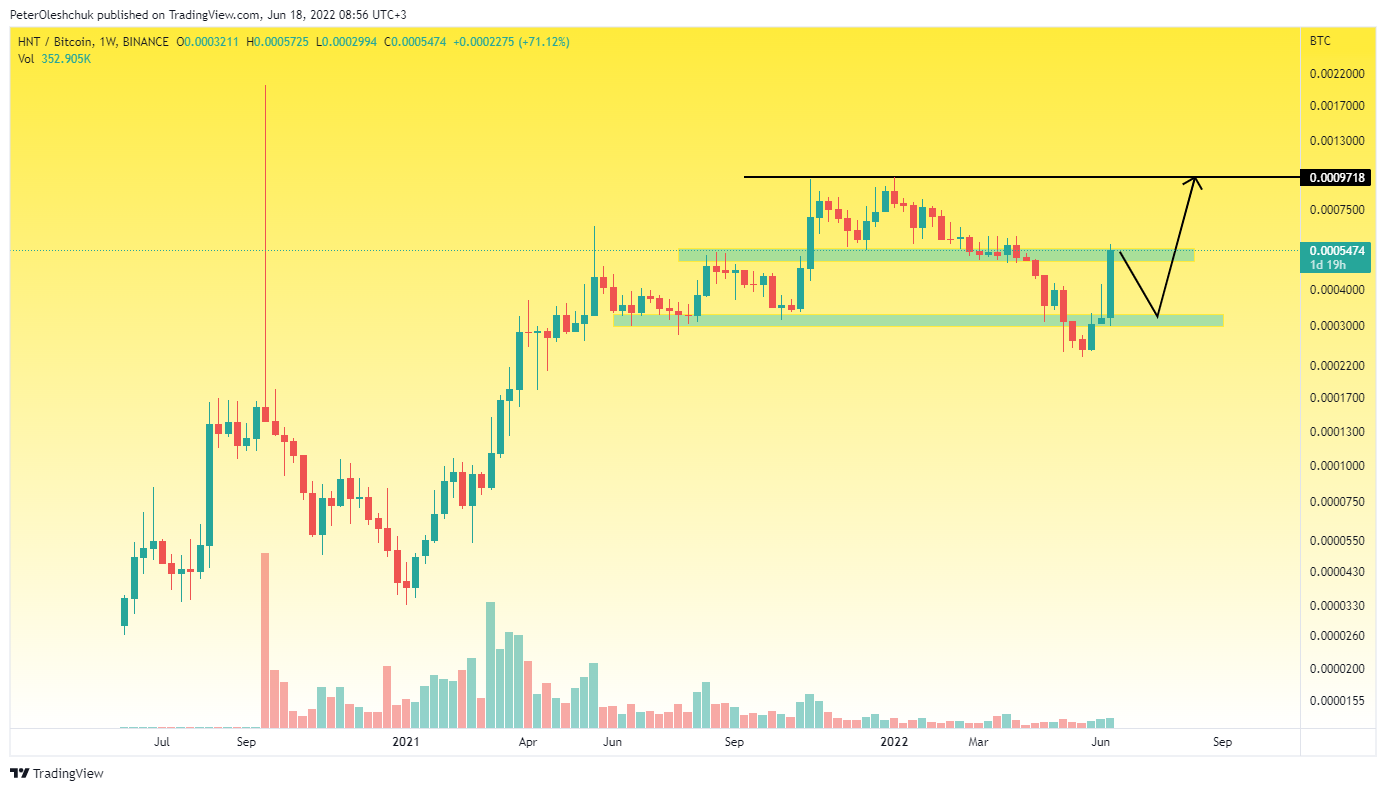 Source: https://www.tradingview.com/x/QJJdKXhX/ The weekly chart of HNTBTC clearly shows that Bitcoin investors, who were disappointed of the BTC strength began to pour their capital into HNT. Of course, the HNT cryptocurrency is not the only one in the market where this has happened. However, as terrible as the Bitcoin candle is in the weekly timeframe, so beautiful is the HNT candle. At the time of writing, the HNTBTC price has reached 0.00053. this price level has never acted as a reversal. Therefore, the worst-case scenario at the moment is the retest of the 0.00033 liquidity zone and the continuation of the 0.00097 growth wave.