The Polkadot price analysis shows bears have extended their rule, as a strong correction in DOT price is observed today. The strong support at $7.3 has crashed today as market pressure continues, and the trading volume has dropped significantly, leaving DOT looking for newer support levels below the $7 level.
When the market crashed on 16 June 2022, the DOT price also crashed, and the price declined exponentially, damaging the coin’s value. Yesterday bulls tried to make some recovery but were not very successful, and recovery was minimal as bears took over and the coin started to prime for further downfall. Today bears took charge again, and the downfall intensified, and yet no support has been seen.
DOT/USD 1-day price chart: DOT loses another eight percent
The 1-day Polkadot price analysis shows the coin underwent further damage and traded in a range downwards of $7.3 to $6.7 while trading hands at $6.71 at the time of writing. DOT/USD shows a decline in price value by 8.6 percent over the last 24 hours as the trading volume has gone down more than 32 percent during this time, and the price also went through huge losses over the past week, amounting to 22.4 percent. The market cap has been affected by 9.02 percent as the coin price depreciated.
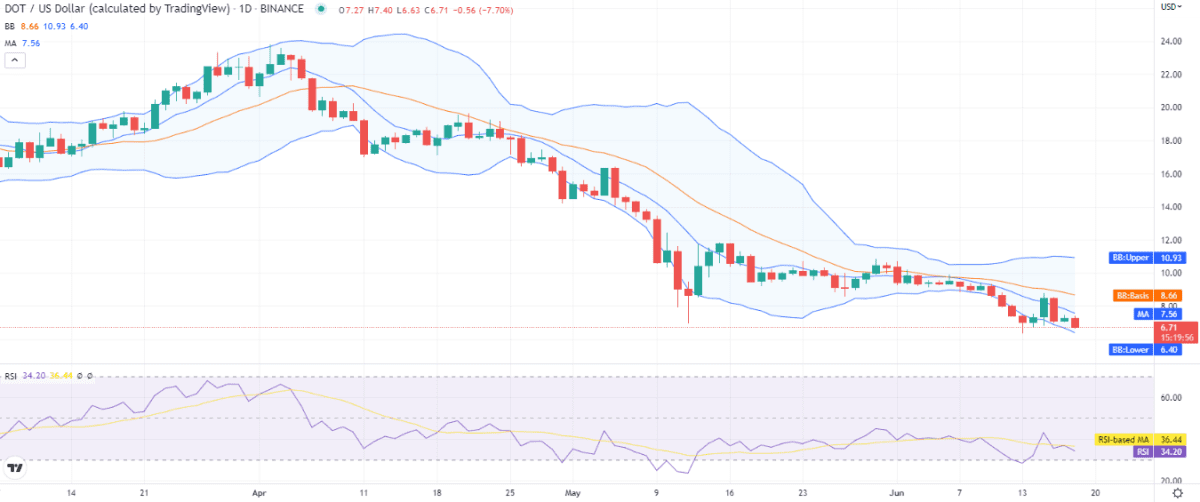
The 1-day chart shows higher volatility for the cryptocurrency, and the Bollinger bands show movement downwards on the lower end, hinting that the price to decrease further in the coming days. As the price is trading near the lower band, the lower band represents support for DOT at $6.40, and the mean average of the indicator is forming at the $8.06 mark. Whereas the upper band at $10.9 3 shows the strongest resistance for DOT, which is quite far above the current price and not relevant in the current scenario.
The moving average (MA) continues to trade above the price, with quite a gap between both values. The MA is present at the $7.56 mark currently. The relative strength index (RSI) is trading very low at index 34. Though RSI is in the neutral zone, its curve indicates the selling pressure in the market, and the coin is moving towards the undersold zone, which is a strong bearish territory.
Polkadot price analysis: Recent developments and further technical indications
The 4-hour Polkadot price analysis shows the price breakout was downwards, and the price fell steeply a few hours back, and the downfall has also been observed during the last 4-hour as well. A further decrease in price value can also be expected if the selling pressure continues.
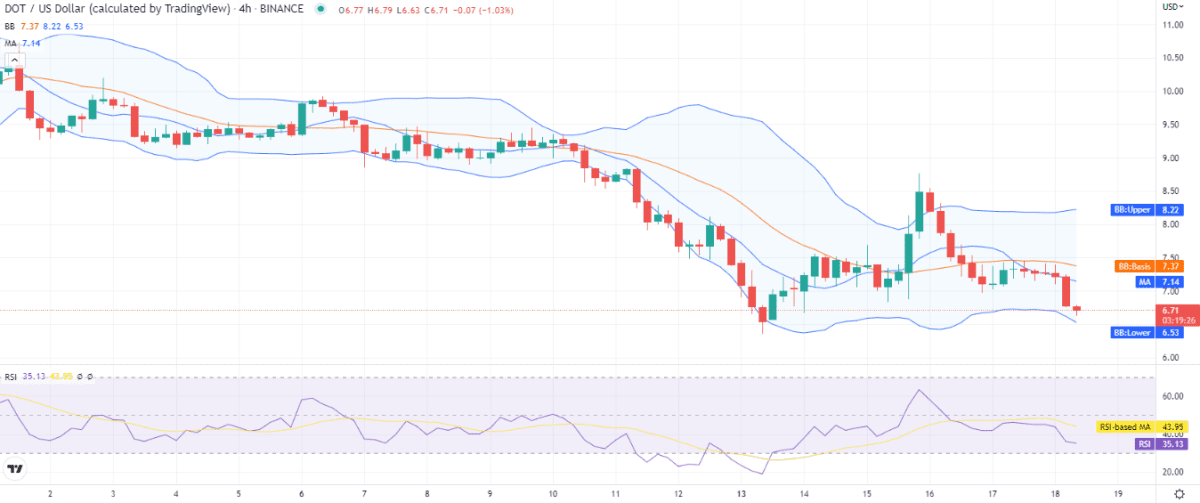
The volatility is also increasing on the 4-hour chart, and the lower end of the volatility indicator is moving downwards at the $6.53 mark representing support for DOT, and its downwards movement indicates an increase in volatility which is more helpful for the bears in the current situation. The RSI also shows a downward curve as the indicator moves towards the oversold region and is currently present at index 35.
Polkadot price analysis conclusion
The Polkadot price analysis concludes that the coin value has decreased again and has stepped down to the year’s lowest. However, the coin price is expected to decrease further in the coming hours as the RSI curve still shows movement on the daily and hourly charts downwards.
Disclaimer. The information provided is not trading advice. Cryptopolitan.com holds no liability for any investments made based on the information provided on this page. We strongly recommend independent research and/or consultation with a qualified professional before making any investment decisions.