After the surprising high of Bitcoin Cash [BCH] at the beginning of the past weekend, proponents looked hopeful but the market correction soon pushed back the positive prospects. Just a day after BCH added over $60 million to its market cap in, the market cap stumbled by 5.43 percent as stabilizing forces began to take over.
The price of Bitcoin Cash has declined by over 5 percent against the US dollar and is now the second-worst performing coin in the top-10, behind Litecoin [LTC]. The market cap of the Bitcoin hardfork is now under $2.2 billion, with the coin’s price down to $124, after reaching $131 just 48 hours ago.
In terms of exchange volume division, P2PB2B boasts the three highest BCH trading volumes, with $16.47 million (7.29 percent), $15.47 million (6.85 percent), and $14.78 million (6.54 percent) with the BCH/USD, BCH/BTC, and BCH/ETH respectively. The trailing top exchanges are LBank and BitMart.
1-hour:

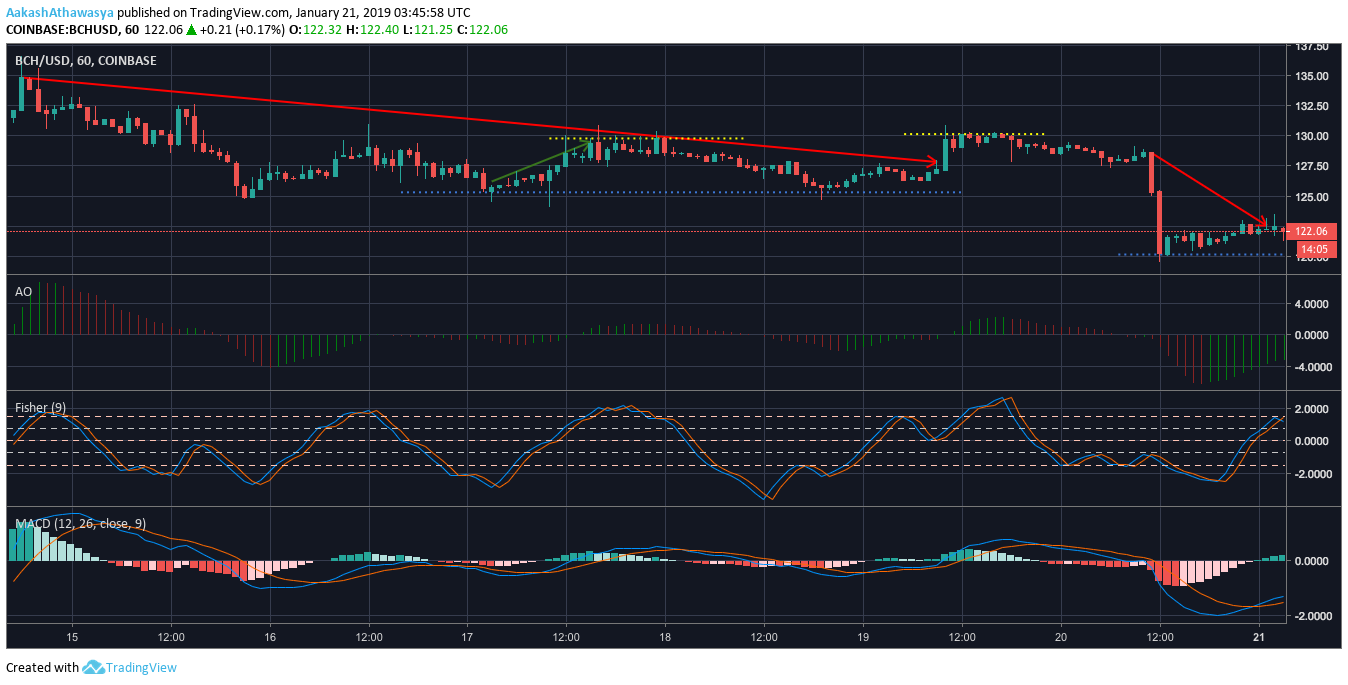
Straight off the bat, two prominent downtrends stick out in the one-hour chart, the first extending from $134.85 to $127.83 and the second, a more immediate one, ranging from $128.6 to $122.5. No prominent uptrend is noticed, barring a brief one from $126.21 to $129.49.
Bitcoin Cash has found support level at $125.41 during the previous week with the more immediate support level at $120.41. The two resistance levels mimic each other at $129.79 and at $130.51 respectively.
The Awesome Oscillator indicates a bullish market, as the AO line is below 0, with decreasing momentum as the bars are reducing their severity.
The Fisher Transform indicates a bullish switch in the market.
The MACD line shows that Bitcoin Cash has been in a bearish market since 10:00 UTC on 20 January. However, it has shifted to the bull’s side now.
1-day:

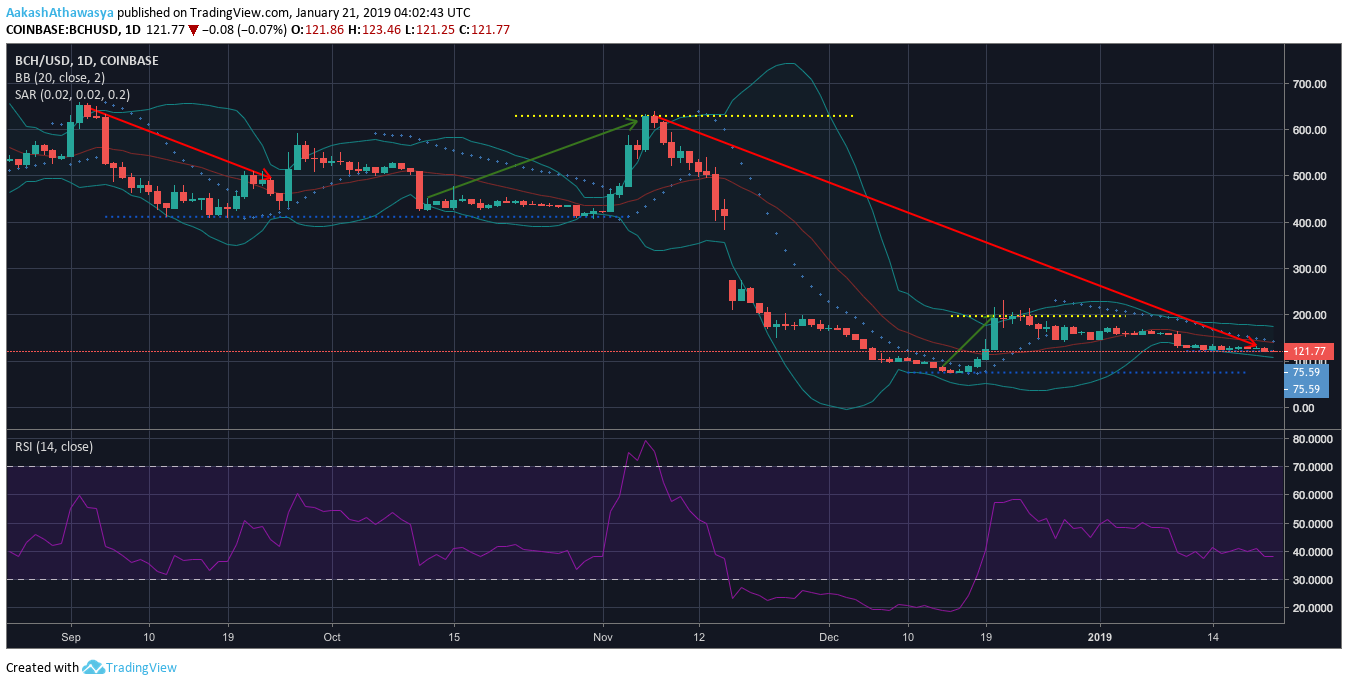
In the one-day chart, Bitcoin Cash witnessed two significant downtrends, one before the hardfork and one after it. The more prominent latter downtrend still persists and has extended from $629.55 to $134.26, a whopping 78.67 percent decline. In the midst of the aforementioned downtrend, a brief uptrend was noticed from $88 to $199.7 in mid-December.
Bitcoin Cash found resistance at $629.55 immediately prior to the hardfork, and since then the next resistance level was recorded at $197.44. The coin’s major support level in the one-day chart was pegged at $411.8, in September and October, however, it has since dipped to $75.59.
The Bollinger Bands indicates that the volatility of Bitcoin Cash has decreased since the start of the year while the Moving Average line points to a bearish trend.
The Parabolic SAR shows that the bears have taken control of the BCH market post-Christmas, with the dotted lines aligned above the coin’s one-day trend line.
The Relative Strength Indicator shows that Bitcoin Cash is being increasingly sold-off by investors since mid-December. At press time, the RSI of BCH stood at 38.44, down from 58.19 on 23 December, 2018.
Conclusion
The recent decline of Bitcoin Cash has followed the trend since the coin’s hardfork, as indicated by the one-hour and the one-day chart. However, major indicators point to a bullish market for Bitcoin Cash now.
 ambcrypto.com