|
|
Polkadot and BakeryToken prices are firm, printing higher highs. If DOT/USDT holds above $20, it may race to $30. Meanwhile, BAKE is under pressure, but buyers are eyeing $5.
Bakery Token (BAKE)
BAKE is part of the BakerySwap ecosystem. Liquidity providers receive the token as rewards.
Past Performance of BAKE
Prices remain in a tight squeeze in a triangle above a critical support line.
In all, bears have the upper hand, although the uptrend is still valid reading from the daily chart.
As of writing on June 18, BAKE is bearish, losing versus a resurgent USD on the last day of trading.
Meanwhile, participation is tapered, mirroring resistance to the upside of the past few weeks.
Day-Ahead and what to Expect
Encouragingly, BAKE/USDT prices are inside gains of the last week of May.
With comparatively low trading volumes inside the double bar bullish reversal pattern, BAKE bulls stand a chance as long as the $2.5 and $3 support zone hold.
BAKE/USDT Technical Analysis
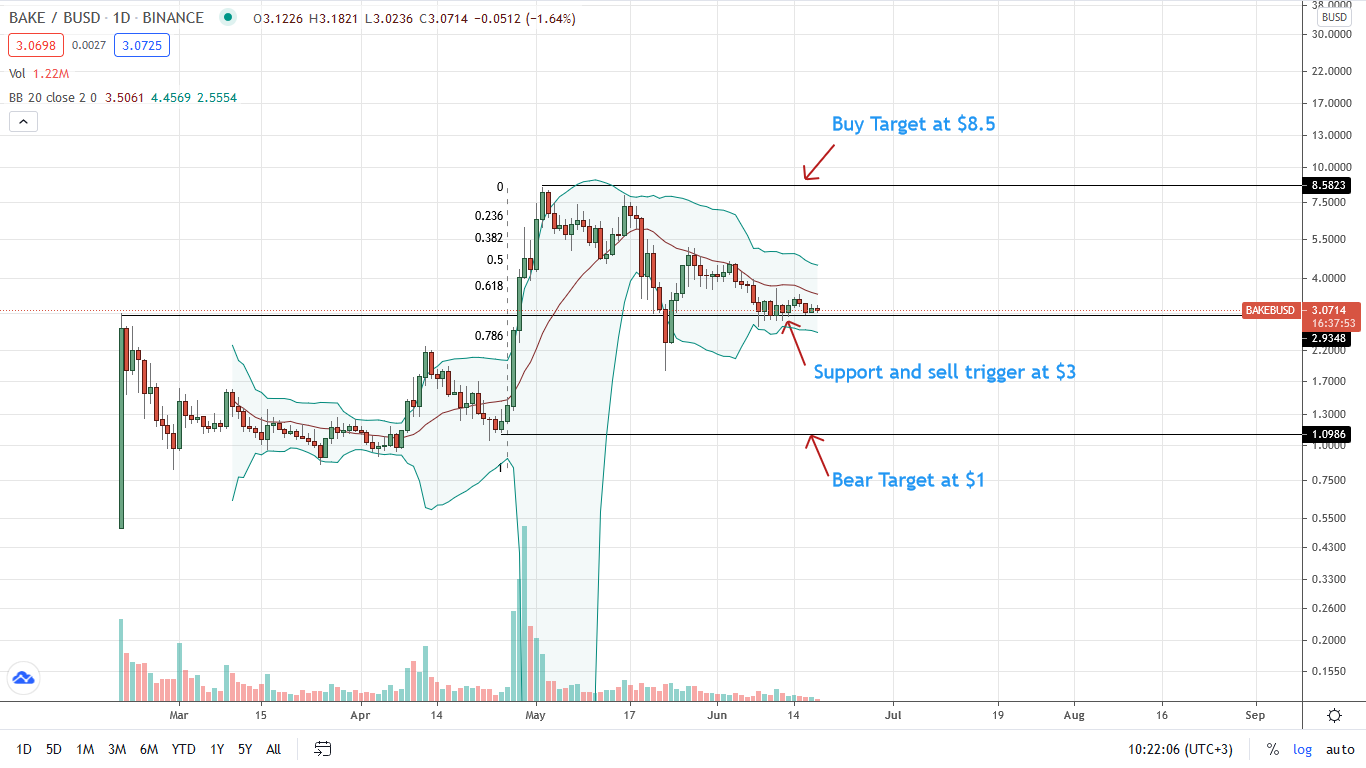
The uptrend is valid since BAKE/BUSD prices are within the $2.5 and $3 support zone.
Gains above $4 and the middle BB would revive optimistic bulls aiming for $5 and $8.5 in the medium term.
On the flip side, losses below $2 cancel bulls, shifting supply to BAKE bears targeting $1.
Polkadot (DOT)
DOT is the utility currency behind the interoperable blockchain and Ethereum competitor, Polkadot.
Past Performance of DOT
DOT prices are fluctuating, waving along the middle BB. Technically, the negative gradient of the 20-day moving average suggests weakness, aligning momentum with bears. All the same, the uptrend is valid as long as $20 holds. Presently, DOT is in red, losing against BTC, USD, and ETH on the last day of trading.
Day-Ahead and what to Expect
Sellers are in charge. DOT/USDT prices are inside a bear flag.
From the daily chart, DOT has support at $20, but there are higher highs based on gains of May 24.
Still, if $20 holds, DOT may rally towards $30 in a buy trend continuation.
DOT/USDT Technical Analysis
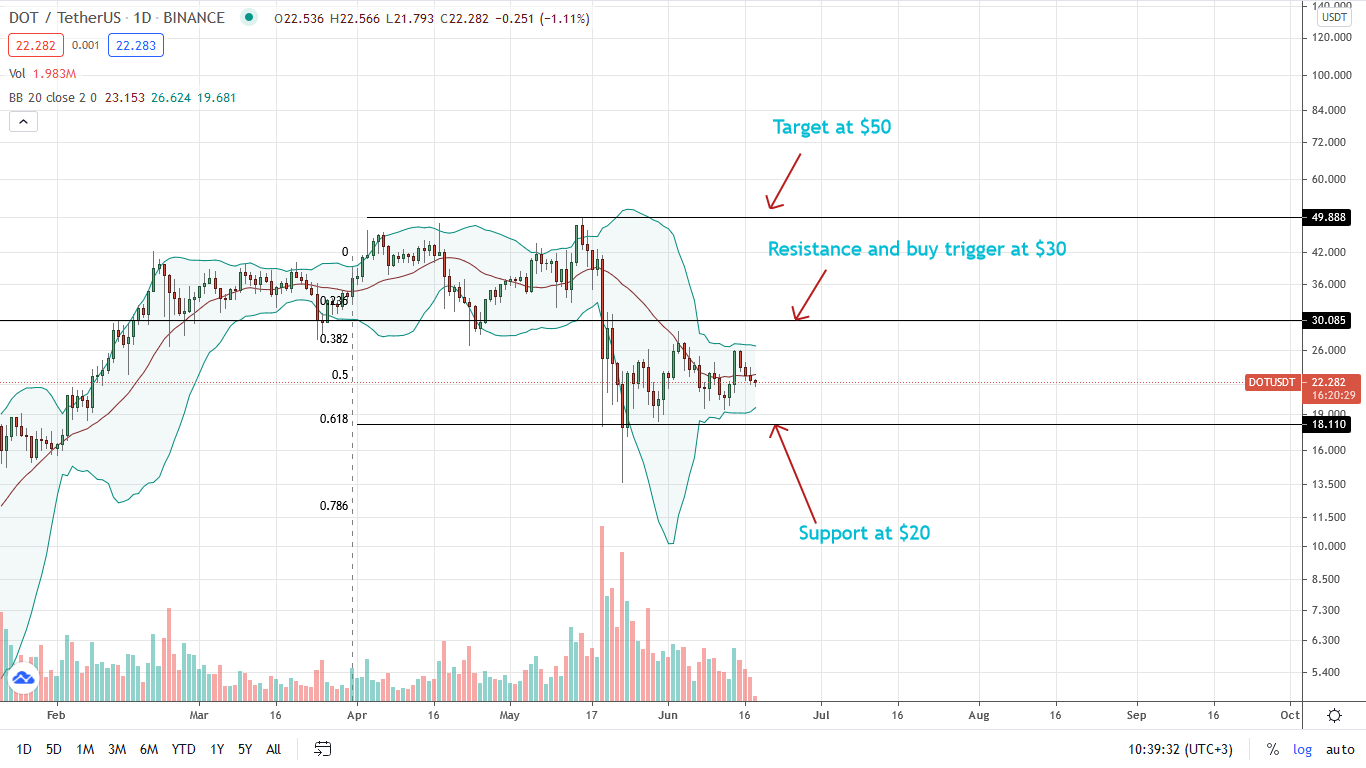
Reading from the daily chart, sellers have the upper hand as prices gyrate inside the bear wedge.
The good news is that DOT/USDT prices are inside gains of May 24 which aligns bulls, a ground for aggressive DOT bulls to load the dips with targets at $30 in the immediate term.
On the reverse, if DOT/USDT tumbles below the middle BB and $20, sellers may force the coin back to $10 in a bear trend continuation pattern.