Despite being just over two months old, Bitcoin SV has made its mark on the collective market. From being backed and lauded by Craig Wright as the true Bitcoin Cash to even overtaking BCH on the global coin ladder, for a brief spell albeit, BSV now caps off the top-10 and is ahead of major coins like Cardano [ADA], IOTA [MIOTA] and Monero [XMR].
Bitcoin SV is currently trading at $77.29 with a market cap of $1.35 billion at press time, leading Cardano by over $200 million. The cryptocurrency is best represented, in terms of trading volume on Bit-Z, accounting for $6.86 million or 11.48 percent of trading volume in the BCHSV/BTC trading pair.
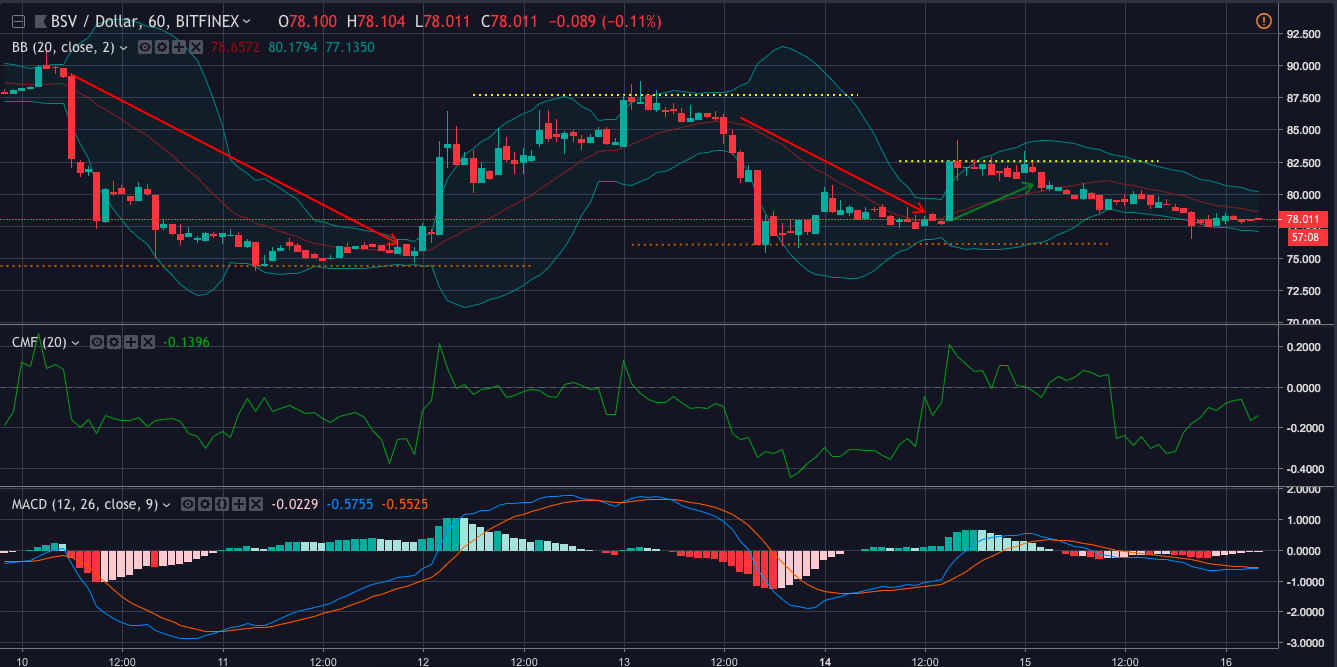
1-hour
Bitcoin SV [BSV] Technical Analysis: BSV remains in the top-10 but fails to find momentum
The immediate key support level for the coin is placed at $76.18, which the coin is inching towards. The key resistance level of the coin was $87.71 and has since dipped to $82.57.
The Chaikin Money Flow indicates that the coin is trading in a bearish market as the CMF line is below 0, showing that investors are withdrawing their money from BSV.
The MACD Line indicates that the coin moved into a bearish territory at 1200 UTC on 15th January.
The Bollinger Band indicates that the volatility of Bitcoin SV is decreasing as the price movement begins to decrease. The Moving Average line points to a bearish trend.
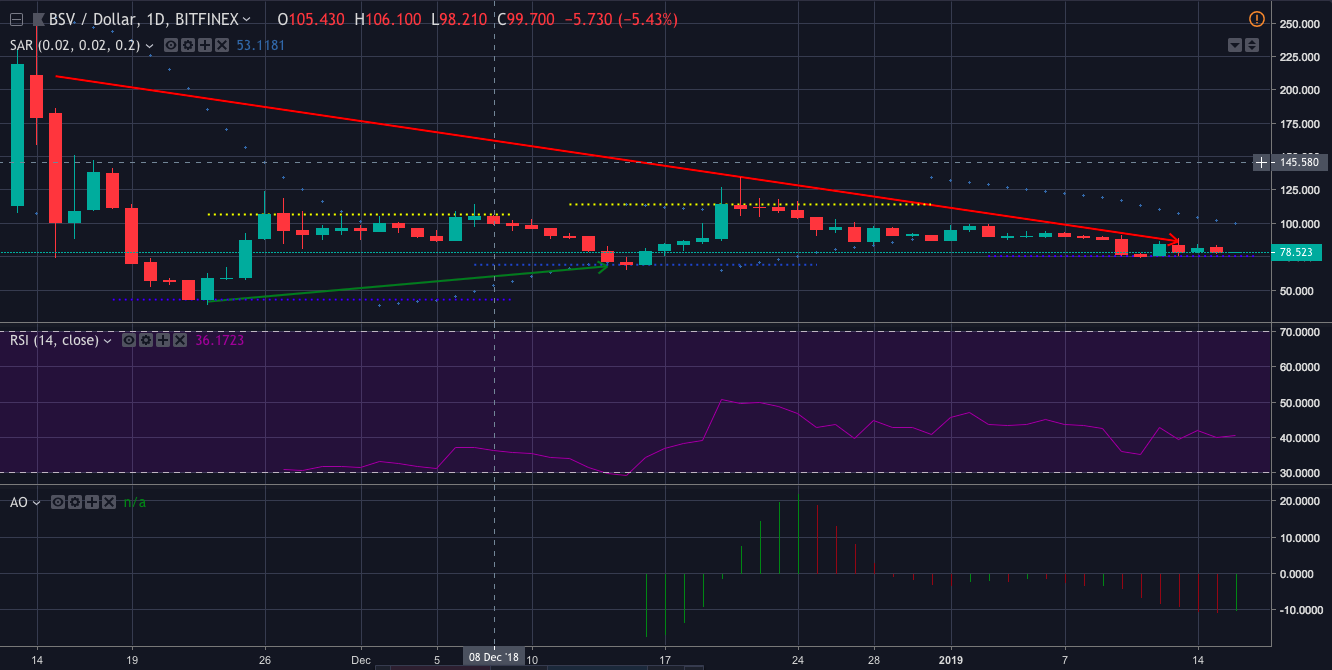
1-day
Bitcoin SV [BSV] Technical Analysis: BSV remains in the top-10 but fails to find momentum
The immediate key support level of the coin is placed at $75.44, which the coin is nearing, while previous support levels were recorded at $69.09 and $49.92. The immediate key resistance level of the coin was recorded at $114.67, which the coin breached in December.
The Relative Strength Index shows a declining trend as investors are selling off their BSV coins, with the RSI pegged at 39.99.
The Parabolic SAR indicates a bearish market as the dotted lines are aligned below the coin’s trend line.
The Awesome Oscillator points to a bullish market as the AO lines have turned green.
Conclusion
Bitcoin SV has been on a declining trend since the coin began trading post the hardfork in November 2018. Despite a few brief uptrends in late-December and early-January, the coin’s price has been falling. All the major indicators are now pointing to a bearish spree, with coin closing in on its support level.