Polkadot price analysis shows an extremely bearish market trend as the price began trading in a sloping channel. Within the last 24-hours, DOT prices have declined by 11.26 percent and are currently trading at $7.64. The market trend for DOT is extremely bearish as the market has formed lower highs and lower lows. The bear market is confirmed as the moving averages are in a bearish crossover. The immediate support for DOT lies at $7.62 and any further decline could see prices reach $7.50.
The trading volume for DOT/USD has increased and it is currently at$583,323,032.61 while the market capitalization remains at $7.5 billion. The overall market is in bloodshed as most of the top assets have declined by double digits. DOT is currently ranked at number 8 on CoinMarketCap’s list.DOT prices have been trading around $7.5 for most parts of the day. Minor supports are seen at $7.62 and $7.50 while the immediate resistance lies at $8.0.
Polkadot price analysis: Recent developments and further technical indications
The 4-hour chart shows that DOT has formed a descending triangle pattern which is a bearish continuation pattern. The MACD indicator is in the bearish zone and is currently declining. The RSI indicator is also in the oversold region but is showing signs of a bullish divergence. This is a positive sign as it indicates that the selling pressure might be exhausted.
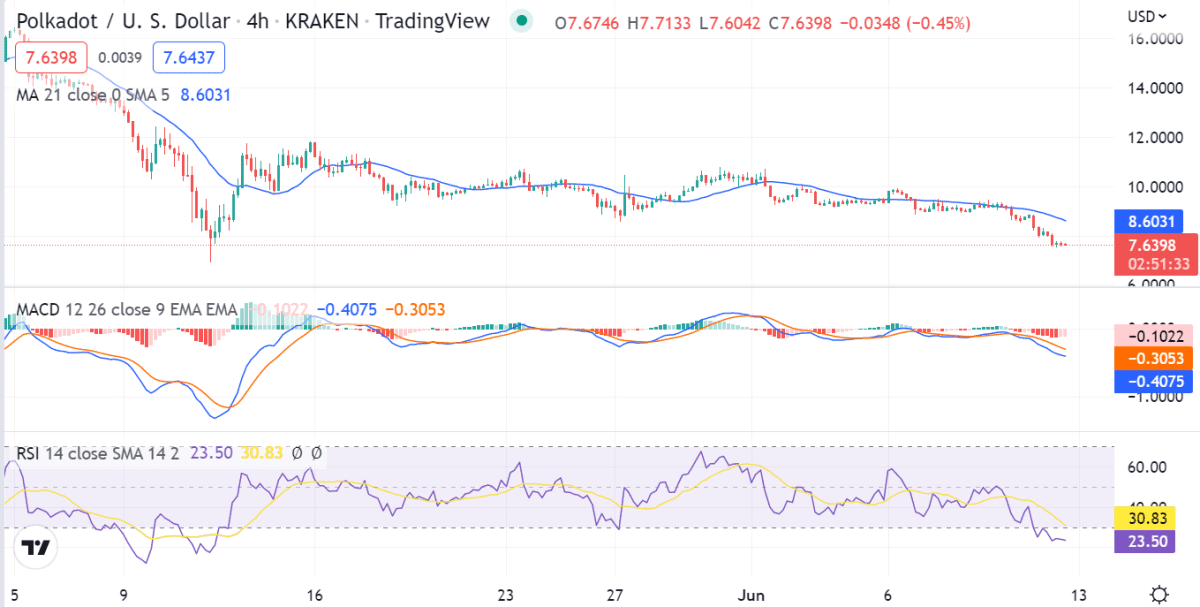
On the 4-hour candlesticks, a bearish engulfing pattern has formed which is a bearish reversal pattern. This pattern indicates that the market might see some correction in the near term. Buyer and seller pressure can be seen to be similar over the past few daily candlesticks, however, the market has still managed to make new lows. The moving average indicator shows that the price is trading below the 21-period and 50-period moving averages which is a bearish sign.
Polkadot price analysis on the daily timeline: DOT remains consistent with the bearish dynamics
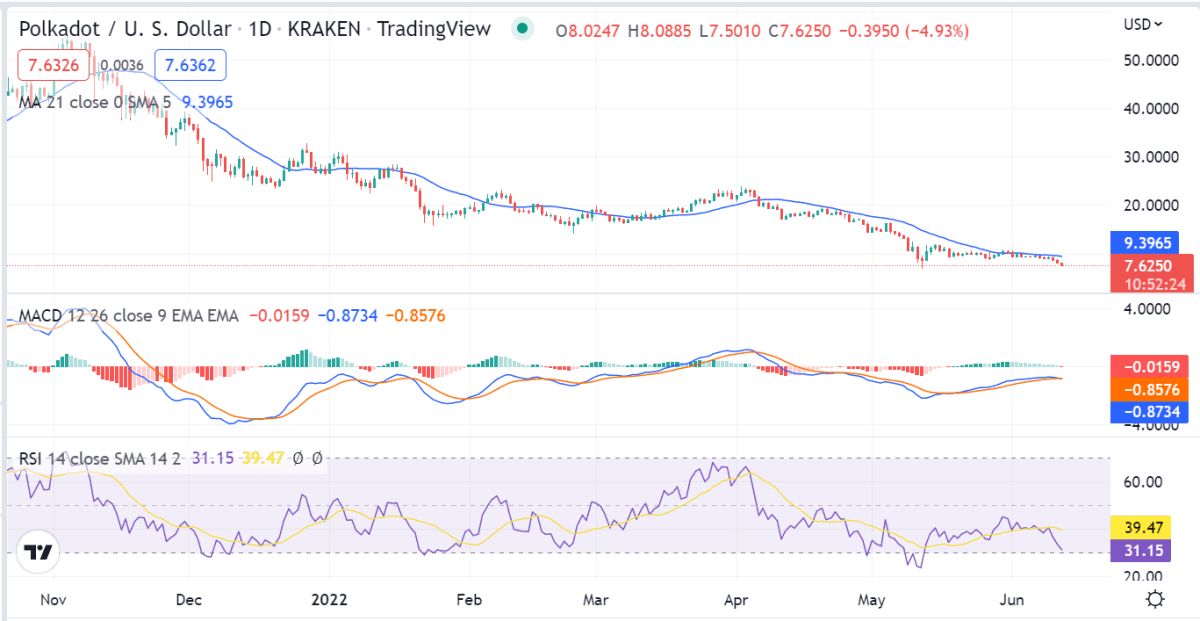
The daily chart for DOT/USD shows that the market is in a strong downtrend as the price is trading below the moving averages. The MACD indicator is in the bearish zone and is currently declining. The RSI indicator is also in the oversold region but is showing signs of a bullish divergence. This is a positive sign as it indicates that the selling pressure might be exhausted.
Polkadot price analysis reveals that the market is in a bearish trend and any corrective rallies should be sold into. However, its position is bound to change over the next few days as most of the market is in a consolidation phase.
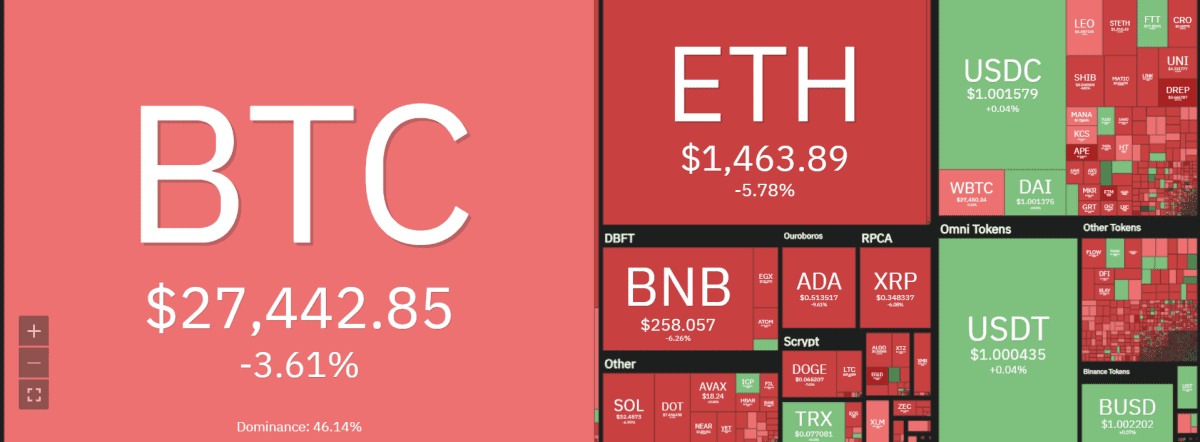
The overall market conditions are extremely bearish as most of the top assets have declined by double digits. The sell-off in the market has been triggered by a number of factors including the sell-off in Bitcoin, Ethereum, and other major altcoins. However, DOT has held up relatively well compared to other assets and is currently trading at $7.0.
Polkadot price analysis conclusion
From the technical indicators, it can be seen that the market is extremely bearish. The next few days are crucial for DOT as a break below $7.0 could see prices decline towards $6.5. On the other hand, if the price manages to hold above $7.0, we might see a move towards $8.0.
Disclaimer. The information provided is not trading advice. Cryptopolitan.com holds no liability for any investments made based on the information provided on this page. We strongly recommend independent research and/or consultation with a qualified professional before making any investment decisions.