Tron, the ninth-largest cryptocurrency has been performing better than every other cryptocurrency even in the brutal bear market. The price of TRX, at the time of writing, was at $0.0252 with a market cap of $1.68 billion.
The 24-hour trade volume for Tron is $313 million and most of it is contributed by Korean exchange, Upbit via trade pair TRX/KRW. Upbit contributes a total of 13.17%. Following it is Binance which contributes a total of ~24% via trade pairs TRX/USDT and TRX/BTC.
1-hour
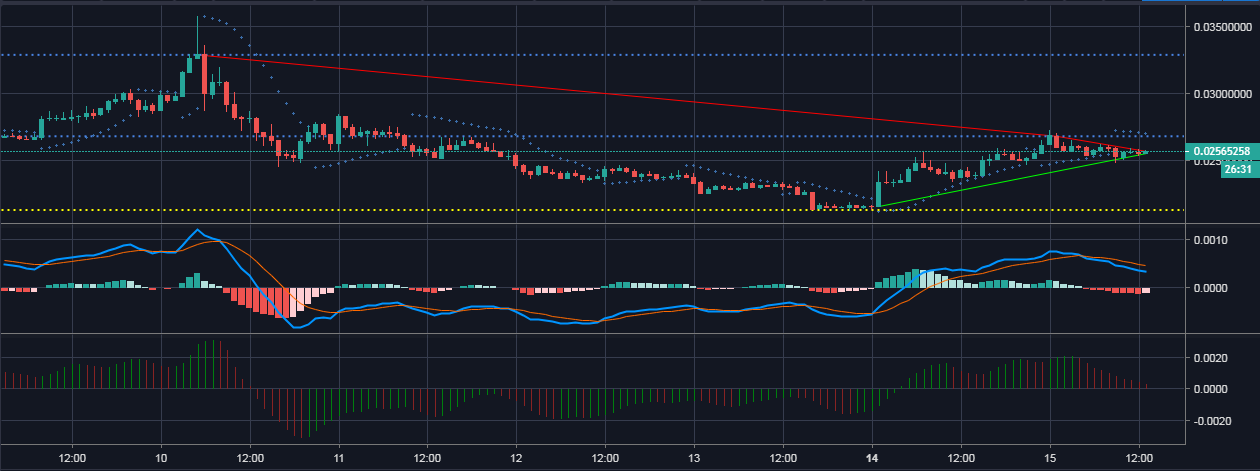
Source: TradingView
The one-hour chart shows an uptrend that extends from $0.0215 to $0.0254 while the downtrend extends from $0.0328 to $0.02566. TRX bounced off the support at $0.0212 that was created by the dip in prices on January 13, 2019. The resistance points for TRX in the shorter time frame can be seen at $0.0267 and $0.0328.
The Parabolic SAR markers have spawned above the price candles, indicating a bearish pressure for the prices.
The MACD indicator is also indicating the same trend, i.e, a bearish crossover to the bottom. The histogram has shifted to red bars below the zero-line.
The Awesome Oscillator shows decreasing red bars that are getting closer to the zero-line indicating that the prices are decreasing steadily.
1-day
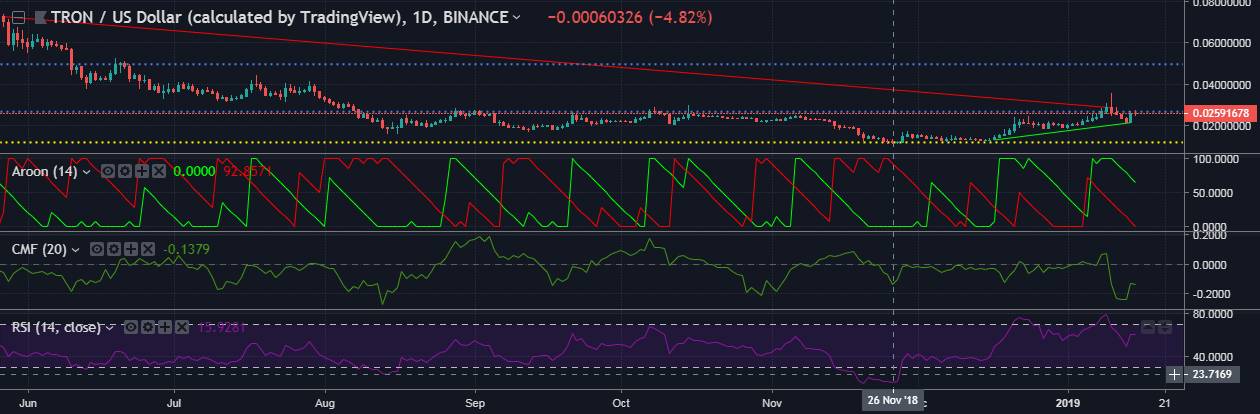
Source: TradingView
The uptrend in the one-day time frame shows that it extends from $0.0132 to $0.0215 while the downtrend ranges from $0.0725 to $0.0287. The prices are supported at $$0.0120 but the resistance points are seen hanging at $0.0268 and $0.0496. The former resistance point was breached January 8, 2019.
The Aroon indicator shows a prevailing uptrend as indicated by the Aroon green line. The Aroon red line has hit the zero-line indicating that the downtrend has exhausted.
The Chaikin Money Flow shows that money is flowing out of the market and that the sellers are dominating the market for Tron.
The Relative Strength Index shows the same as CMF as the RSI seems to be stuck in the middle indicating that the buying momentum and the selling momentum for Tron markets are balanced.
Conclusion
The one-hour chart for TRX is nothing but bearish indicated by SAR, MACD, and AO indicators. The one-day time frame shows a bearish trend as well, with Aroon, RSI and CMF indicators.